Download
1 / 9
90 likes | 320 Views
resveratrol ( μ M). resveratrol ( μ M). M. 0 10 30 75. 0 10 30 75. M. 0 10 30 75. 5000 bp. 1500 bp. 500 bp. 0 10 10. DNase I (units).

E N D
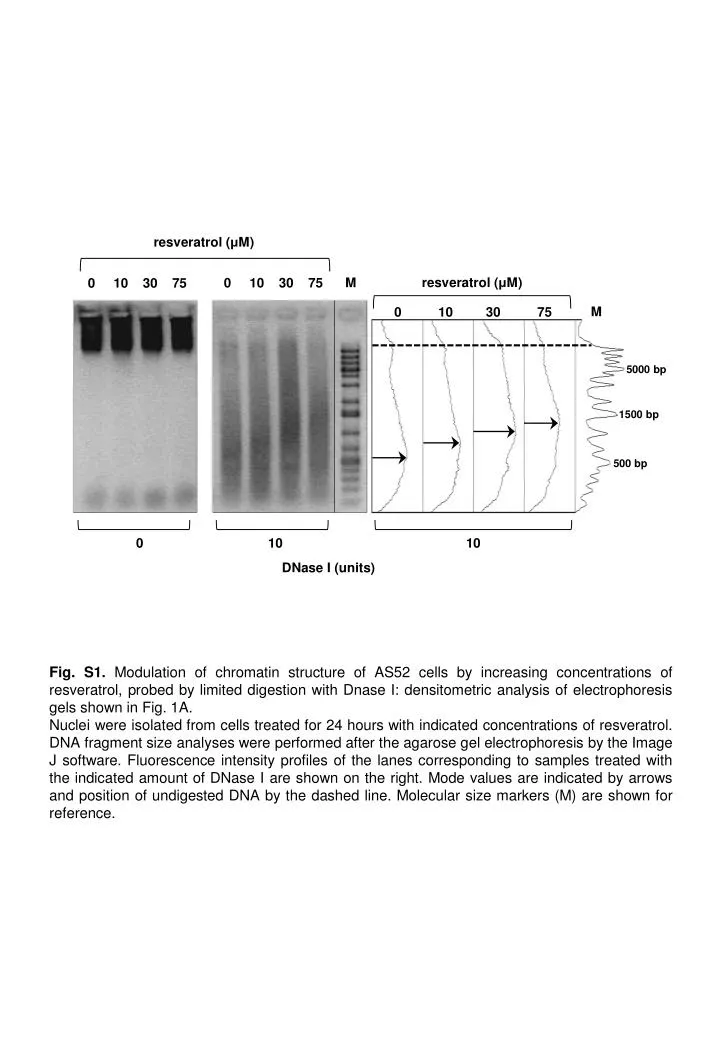
resveratrol (μM) resveratrol (μM) M 0 10 30 75 0 10 30 75 M 0 10 30 75 5000 bp 1500 bp 500 bp 0 10 10 DNase I (units) Fig. S1. Modulation of chromatin structure of AS52 cells by increasing concentrations of resveratrol, probed by limited digestion with Dnase I: densitometric analysis of electrophoresis gels shown in Fig. 1A. Nuclei were isolated from cells treated for 24 hours with indicated concentrations of resveratrol. DNA fragment size analyses were performed after the agarose gel electrophoresis by the Image J software. Fluorescence intensity profiles of the lanes corresponding to samples treated with the indicated amount of DNase I are shown on the right. Mode values are indicated by arrows and position of undigested DNA by the dashed line. Molecular size markers (M) are shown for reference.
BA (0.3 mM) BA (0.3 mM) BA (0.3 mM) TSA (30 nM) TSA (30 nM) TSA (30 nM) BA (2 mM) BA (2 mM) BA (2 mM) control control control M M 5000 bp 1500 bp 0 7 7 DNase I (units) 500 bp Fig. S2. Modulation of chromatin structure of AS52 cells by the HDAC inhibitors butyrate (BA) and trichostatin A (TSA), probed by limited digestion with DNase I: densitometric analysis of electrophoresis gels shown in Fig. 1D. Nuclei were isolated from cells treated for 24 hours with indicated concentrations of the substances. DNA fragment size analyses were performed after the agarose gel electrophoresis by the Image J software. Fluorescence intensity profiles of the lanes corresponding to samples treated with the indicated amount of DNase I are shown on the right. Mode values are indicated by arrows and position of undigested DNA by the dashed line. Molecular size markers (M) are shown for reference.
resveratrol (μM) resveratrol (μM) resveratrol (μM) 0 10 30 75 M 0 10 30 75 0 10 30 75 M 5000 bp 1500 bp 0 10 30 75 500 bp 0 5 5 15 DNase I (units) Fig. S3. Effect of increasing concentrations of resveratrol on the global chromatin structure of HeLa cells, probed by limited digestion with DNase I. Nuclei were isolated from cells treated for 24 hours with indicated concentrations of the substance. DNA fragment size analyses were performed after the agarose gel electrophoresis by the Image J software. Fluorescence intensity profiles of the lanes corresponding to samples treated with the indicated amounts of DNase I are shown on the right. Mode values are indicated by arrows and position of undigested DNA by the dashed line. Molecular size markers (M) are shown for reference.
8 resveratrol removed 7 cell count (log10) 6 5 0 24 48 72 time (hours) solvent 30 µM 1 µM 75 µM 5 μM 100 µM 10 µM Fig. S4. Effect of resveratrol (24-hour treatments) on the proliferation of HeLa cells.
(7) (4) (14) glutathione (nmol / 100 µg protein) (5) Fig. S5. Effect of resveratrol (75 µM, 24 hours) on the total glutathione levels in AS52 and HeLa cells. The numbers of independent determinations are indicated above the columns. Columns indicate means ± S.D.
A B C not irradiated 2.9 J/m2 UV-B 2.0 100 1.5 T4EV sites /106 bp 50 1.0 T4EV sites (% unrepaired) 0.5 0 0 0 10 30 75 0 10 30 75 solvent resveratrol (µM] resveratrol (µM] 75 µM resveratrol 100 * T4EV sites (% unrepaired) 50 0 0 4 8 12 16 Fig. S6. Influence of resveratrol on the generation and repair of UV-B induced damage in HeLa cells. CPDs in chromosomal DNA were quantified by alkaline elution as T4 endonuclease V sensitive (T4EV) sites. (A) Effect of a pretreatment with resveratrol (24 h) on the generation of CPDs (n≥3). (B) Effect of resveratrol on the CPD repair kinetics (n≥3). (C) Concentration-dependent effect of resveratrol on the fraction of unrepaired CPDs measured 8 hours after UV-B exposures (n≥3). Data indicate means ± S.D. Student´s t-test: * p < 0.05. repair time (hours)
A B C no damage induction Ro19-8022+light 100 Fpg sites /106 bp 50 0 Fig. S7. Influence of resveratrol on the generation and repair of DNA base modifications induced by photosensitization in HeLa cells. Oxidized purine species (predominantly 8-oxoG) in chromosomal DNA were quantified by alkaline elution as Fpg-sensitive sites. (A) Effect of a pretreatment with resveratrol (24 h) on the induction of the Fpg-sensitive base damage by irradiation with light in the presence of 100 nM Ro19-8022 (n≥3). (B) Effect of resveratrol on the repair kinetics of the Fpg sensitive DNA lesions (n≥3). (C) Concentration-dependent effect of resveratrol on the fraction of unrepaired Fpg sensitive DNA lesions 3 hours after the damage generation (n≥3). Data indicate means ± S.D. 0 10 30 75 100 resveratrol (µM) Fpg sites (% unrepaired) 50 solvent 75 µM resveratrol 0 100 10 0 30 75 resveratrol (µM) Fpg sites (% unrepaired) 50 0 1 2 3 4 5 6 0 repair time (hours)
100 solvent 30 nM TSA 50 SSB (% unrepaired) 0 0 10 20 30 40 50 60 repair time (min) Fig. S8. Influence of TSA on the repair of DNA single-strand breaks (SSB) induced in AS52 cells by H2O2. Cells were pretreated 24 hours with 30 nM trichostatin A (TSA) and exposed to H2O2 (150 µM) 15min at 37°C. DNA damage was quantified by alkaline elution. Data indicate means ± S.D.
5000 bp 1500 bp Resveratrol - + + - - - + + + + + + EX 527 - - - - - - - - + + + M M + 500 bp 0 2 3 3 DNase I (units) Fig. S9. Effect of resveratrol (75 µM) and sirtuine inhibitor EX-527 (10 µM) on the global chromatin structure of AS52 cells, probed by its accessibility to DNase I. Nuclei were isolated from cells treated for 24 hours with the indicated substances. DNA fragment size analyses were performed after the agarose gel electrophoresis by the Image J software. Fluorescence intensity profiles of the lanes corresponding to samples treated with the indicated amounts of DNase I are shown on the right. Mode values are indicated by arrows (two arrows in graphs with bimodal distribution) and position of undigested DNA by the dashed line. Molecular size markers (M) are shown for reference.