Download
1 / 23
230 likes | 360 Views
Ireland. U.S. Percent job losses in recessions. 1990. 1983. 1974. 2001. August 2011. 2007. Total Revenues of Top 500 Global Corporations as Percentage of World Income (GDP), 1960–2009. Wages as Percent of Value Added in Manufacturing. Real GPD per capita. Median household income.

E N D
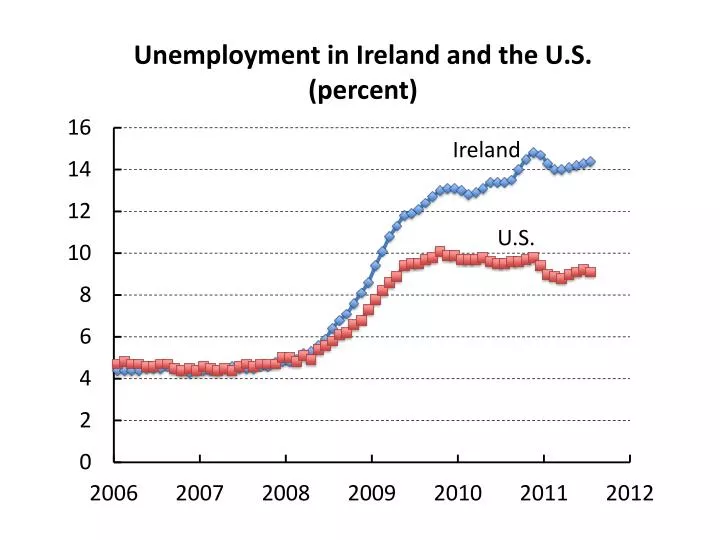
Ireland U.S.
Percent job losses in recessions 1990 1983 1974 2001 August 2011 2007
Total Revenues of Top 500 Global Corporations as Percentage of World Income (GDP), 1960–2009
Real GPD per capita Median household income
Financial Business Household Nonfinancial Business Federal Gov’t State and Local Gov’t.
Penn Central (1970) • U.S. Stock Market crash (1987) • U.S. Savings and loan crisis of the 1980s and 1990s • Finnish banking crisis (1990s) • Swedish banking crisis (1990s) • 1994 economic crisis in Mexico • 1997 Asian financial crisis • 1998 collapse of Long-Term Capital Management • 1998 Russian financial crisis • Argentine economic crisis (1999–2002) • Dot.com stock crash (2001) • Great Recession (Lesser Depression, 2007-?)