Download
1 / 40
420 likes | 831 Views
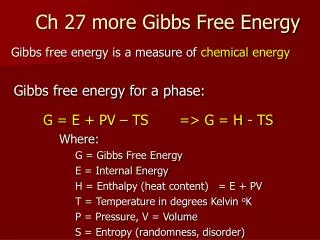
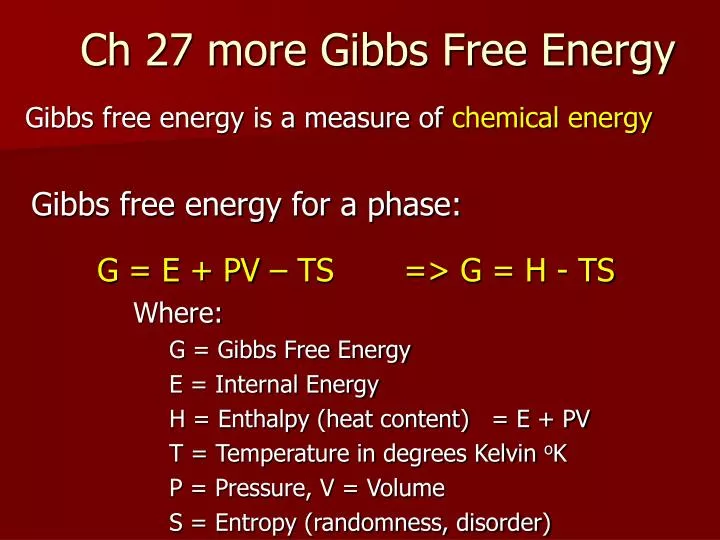
Ch 27 more Gibbs Free Energy. Gibbs free energy is a measure of chemical energy. Gibbs free energy for a phase:. G = E + PV – TS => G = H - TS Where: G = Gibbs Free Energy E = Internal Energy H = Enthalpy (heat content) = E + PV T = Temperature in degrees Kelvin o K

E N D
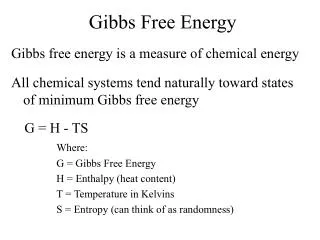
Ch 27 more Gibbs Free Energy Gibbs free energy is a measure of chemicalenergy Gibbs free energy for a phase: G = E + PV – TS => G = H - TS • Where: G = Gibbs Free Energy E = Internal Energy H = Enthalpy (heat content) = E + PV T = Temperature in degrees Kelvin oK P = Pressure, V = Volume S = Entropy (randomness, disorder)
Changes • Thermodynamics treats changes • Regardless of path G = E + PV – TS • We should rewrite the equation for Gibbs Free Energy in terms of changes, D G • DG = E + PDV – TDS for P, T constant • DG = DH – TDS D = pronounced “delta” means “the change in” DH can be measured in the laboratory with a calorimeter. DS can also be measured with heat capacity measurements. Values are tabulated in books. The change in Gibbs free energy, ΔG, in a reaction is a very useful parameter. It can be thought of as the maximum amount of work obtainable from a reaction.
Thermodynamics For a reaction at other temperatures and pressures The change in Gibbs Free Energy is dDG = DVdP - DSdT We can use this equation to calculate G for any phase at any T and P by integrating the above equation. FOR A SOLID_SOLID REACTION If V and S are ~constants, dG = V dP – S dT our equation reduces to: GT2 P2 - GT1 P1 = V(P2 - P1) - S (T2 - T1)
Gibbs for a chemical reaction Hess’s Law applied to Gibbs for a reaction 298.15K, 0.1 MPa • Suppose 3A + 2B = 2C +1D reactants = products • DG = 2GC +1GD -3GA – 2GB • Gibbs Free Energy (G) is measured in KJ/mol or Kcal/mol • One small calorie cal ~ 4.2 Joules J Same procedure for DH, DS, DV
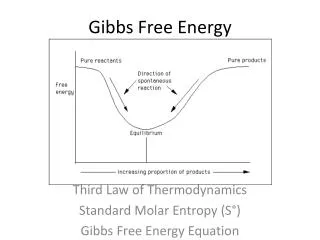
Which direction will the reaction go? DG for a reaction of the type: 2 A + 3 B = C + 4 D DG = S (n G)products - S(n G)reactants = GC + 4GD - 2GA - 3GB Same procedure for DH, DS, DV The reaction with negative DG will be more stable, i.e. if DG is negative for the reaction as written, the reaction will go to the right “For chemical reactions, we say that a reaction proceeds to the right when DG is negative and the reaction proceeds to the left when DG is positive.” Brown, LeMay and Bursten (2006) Virtual Chemistry p 163
Since G = E + PV – TS And we saw the slope of a sum is the sum of the slopes Differentiating dG = dE +PdV +VdP -TdS – SdT What is dE? dE = dQ – dWFirst Law, and dQ =TdS 2nd law So dE = dQ - PdV => dE = TdS – PdV Most of these terms cancel, so dG = VdP –SdT And if we need the changes when moving to a new T,P dDG = DVdP - DSdT
To get an equilibrium curve for a phase diagram, could use dDG = DVdP - DSdT and G, S, V values for Albite, Jadeite and Quartz to calculate the conditions for which DG of the reaction: Ab = Jd + Q is equal to 0 Method: • From G values for each phase at 298K and 0.1 MPa list DG298, 0.1 for the reaction, do the same for DV and DS • DG at equilibrium = 0, so we can calculate an isobaric change in T that would be required to bring DG298, 0.1 to 0 0 - DG298, 0.1 = -DS (Teq - 298) (at constant P) • Similarly we could calculate an isothermal change 0 - DG298, 0.1 = -DV (Peq - 0.1) (at constant T)
NaAlSi3O8 = NaAlSi2O6 + SiO2 Albite = Jadeite + Quartz P - T phase diagram of the equilibrium curve How do you know which side has which phases? Calculate DG for products and reactant for pairs of P and T, spontaneous reaction direction at that T P will have negative DG When DG < 0 the product is stable Figure 27-1. Temperature-pressure phase diagram for the reaction: Albite = Jadeite + Quartz calculated using the program TWQ of Berman (1988, 1990, 1991).
Clausius -Clapeyron Equation dG = VdP –SdT • Defines the state of equilibrium between reactants and products in terms of S and V From Eqn.3, if dG =0, dP/dT = ΔS / ΔV (eqn.4) The slope of the equilibrium curve will be positive if S and V both decrease or increase with increased T and P
D dP S = solve D dT V To get the slope, at a boundary DG is 0 dDG = 0 = DVdP - DSdT gives us the slope Figure 27-1. Temperature-pressure phase diagram for the reaction: Albite = Jadeite + Quartz calculated using the program TWQ of Berman (1988, 1990, 1991). Winter (2001) An Introduction to Igneous and Metamorphic Petrology. Prentice Hall.
P 2 - = G G VdP P P 2 1 P 1 Gas Phases Return to dG = VdP – SdT. For an isothermal process dT is zero, so: For solids it was fine to assume V stays ~ constant For gases this assumption is wrong A gas compresses as P increases How can we define the relationship between V and P for a gas?
Gas Laws • 1600’s to 1800’s • Combined as ideal gas law: • n= # moles, and R is the universal gas constant • R = 8.314472 N·m·K−1·mol−1 Pressure times Volume is a constant Increase Temp, Volume increases Increase Temp, Pressure increases Increase moles of gas, Volume increases
Gas Pressure-Volume Relationships Ideal Gas • As P increases V decreases • PV=nRTIdeal Gas Law • P = pressure • V = volume • T = temperature • n = # of moles of gas • R = gas constant = 8.3144 J mol-1 K-1 Figure 5-5. Piston-and-cylinder apparatus to compress a gas. Winter (2001) An Introduction to Igneous and Metamorphic Petrology. Prentice Hall. So P x V is a constant at constant T
P 2 - = G G VdP P P 2 1 P 1 RT P 2 - = G G dP P P P 2 1 P 1 1 P 2 - = G G RT dP P P P 2 1 P 1 Gas Pressure-Volume Relationships Since we can substitute RT/P for V (for a single mole of gas), thus: and, since R and T are certainly independent of P:
Logarithms • Logarithms (Logs) are just exponents if by = x then y = logb x log10 (100) = 2 because 102 = 100 • Natural logs (ln) use e = 2.718 as a base For example ln(1) = loge(1) = 0 because e0 = (2.718)0 = 1 Anything to the zero power is one. • bx /by = bx-y so logbx - logb y = logb(x/y)
Early on we looked at slopes and areas, and defined derivatives and integrals. We can just look these up in tables. Here is another slope d ln u = 1 du dx u dx The area under the curve is the reverse operation
Gas Pressure-Volume Relationships bx /by = bx-y so logbx - logb y = logb(x/y)
Gas Pressure-Volume Relationships The form of this equation is very useful GP, T - GT = RT ln (P/Po) For a non-ideal gas (more geologically appropriate) the same form is used, but we substitute fugacity ( f ) for P wheref = gPg is the fugacity coefficient GP, T - GoT = RT ln (f /Po) so gH2O ranges 0.1 – 1.5, gCO2 ranges 2 – 50 At low pressures most gases are ideal, but at high P they are not o
Solid Solutions: T-X relationships Ab = Jd + Q was calculated for pure phases When solid solution results in impure phases the activity of each phase is reduced Use the same form as for gases (RT ln P or RT ln f ) Instead of fugacity f, we can use activity a Ideal solution: ai = Xi y = # of crystallographic sites in which mixing takes place Non-ideal: ai = gi Xi where gamma gi is the activity coefficient y y
Dehydration Reactions • Ms + Qtz = Kspar + Sillimanite + H2O • We can treat the solids and gases separately GP, T - GT = DVsolids (P - 0.1) + RTln (P/0.1) (isothermal) • The treatment is then quite similar to solid-solid reactions, but you have to solve for the equilibrium pressure P by iteration. • Iterative methods are those which are used to produce approximate numerical solutions to problems. Newton's method is an example of an iterative method. o
D dP S = D dT V • Muscovite is unstable at High T while Qtz present, dehydrates by reacting w Qtz, forms K-spar and Al-silicate + water. • DV high at low P so high DVgas -> DS/DV low (gentle slope) • DV low at high P (already near limit of compressibility) so -> DS/DV high (steep slope) • Result: Characteristic concave shape; • decarbonation and other devolitilazation reactions are similar Dehydration Reactions Figure 27-2. Pressure-temperature phase diagram for the reaction muscovite + quartz = Al2SiO5 + K-feldspar + H2O, calculated using SUPCRT (Helgeson et al., 1978). Winter (2001) An Introduction to Igneous and Metamorphic Petrology. Prentice Hall.
Ch 27b Geothermobarometry • For any reaction with one or more variable components, at any given P,T ,we can solve for the equilibrium curve using • DG=0= DG0 + RT ln K (27-17) • So ln K = - DG0/RT
Equilibrium Constant K • GP, T = GoT + RT ln (P/0.1 MPa) • At equilibrium the ratio in the parentheses, regardless of how it is expressed (Pressures, chemical potentials, activities), is a constant, called the equilibrium constant, K • GP, T = GoT + RT ln (K)
The units M (molar) are moles per liter Calculating an Equilibrium Constant for a Reaction A mixture of gasses in an inclusion was allowed to reach equilibrium. 0.10 M NO, 0.10 M H2, 0.05 M N2 and 0.10 M H2 O was measured. Calculate the Equilibrium Constant for the equation:
K for an example reaction • For a reaction 2A + 3B = C + 4D K = XCX4D . gCg4D X2AX3B . g2Ag3B where Xi is the mole fraction and gi is the correction, i.e. the activity coefficient, so i.e. K = KD . Kg We will define the Distribution Coefficient, KD, again below. We saw it earlier in Chapter 9.
GP, T - GoT = RT ln (K) and at equilibrium GP, T = 0 • ln K = - DG0/RT • but DGo = DHo –TDSo + DV dP So • ln K = - DHo/RT +DSo/R - (DV/RT) dP (27-26)
Phlogopite is the magnesium end-member of the biotite solid solution series Annite is the iron end-member of the biotite solid solution series A Garnet-Biotite Reaction • Below is the stoichiometric equation for the Fe-Mg exchange in the reaction between the biotites and Ca-free garnets: • Fe3Al2Si3O12 + KMg3Si3AlO10(OH)2 = Mg3Al2Si3O12 + KFe3Si3AlO10(OH)2 • Almandine + Phlogopite = Pyrope + Annite This false color image of a garnet crystal in equilibrium with biotites. The garnet passed from an initial composition of Magnesium-rich Pyrope in its core to Fe-rich Almandine on its rim. ln K = - DH/RT +DS/R - (DV/RT) dP
Application to DH and DS determination The Garnet - Biotite Fe –Mg exchange reaction lnK = - DH/RT +DS/R - (DV/RT) dP y = slope . x + b This is a line! From (27-26) we can extract DH from the slope and DS from the intercept! Figure 27-5. Graph of lnK vs. 1/T (in Kelvins) for the Ferry and Spear (1978) garnet-biotite exchange equilibrium at 0.2 GPa from Table 27-2. Winter (2001) An Introduction to Igneous and Metamorphic Petrology. Prentice Hall.
Geothermobarometry The GASP geobarometer Garnet-aluminosilicate-silica-plagioclase Figure 27-8. P-T phase diagram showing the experimental results of Koziol and Newton (1988), and the equilibrium curve for reaction (27-37). Open triangles (yellow) indicate runs in which An grew, closed triangles (red) indicate runs in which Grs + Ky + Qtz grew, and half-filled triangles (yellow/red) indicate no significant reaction. The univariant equilibrium curve is a best-fit regression of the data brackets. The line at 650oC is Koziol and Newton’s estimate of the reaction location based on reactions involving zoisite. The shaded area is the uncertainty envelope. After Koziol and Newton (1988) Amer. Mineral., 73, 216-233
Assessment of reaction textures • Identify which minerals are early, which are late, and which are part of a stable assemblage. • Early minerals are likely to be inclusions or broken. • Late minerals may be in cracks or strain shadows. • Minerals that are in textural equilibrium should not be separated by reaction zones.
The GASP geobarometer Garnet-aluminosilicate-silica-plagioclase • 3CaAl2Si2O8 = Ca3Al2Si3O12 + 2Al2SiO5 + SiO2 • 3 Anorthite = Grossular + 2 Al2SiO5 + Quartz These Grossular garnets (in association with SiO2 and Al2SiO5) have Anorthite plagioclase rims. They tell us only that the rock passed somewhere through this equilibrium line.
However … • if we have another mineral equilibrium, we may get a crossing line on our PT diagram Pyrophyllite is Al2Si4O10(OH)2
Determining P-T-t History • Zoning in Pl gives successive stages in P-T history; • if we can date these different stages, then we can get P-T-t path. How is this done?
GASP 1 bar = 100000 pascal 1 mb [mbar, millibar] = 100 Pascals Spears 15-47 1 atmosphere [atm, standard] = 1.01 bar Spear’s Classic Paper Gar-Bt
You have a thick section of a metamorphic rock containing Plagioclase, Biotites, Garnets and aluminosilicates (Al2SiO5) , so you run electron microprobe scans across interesting areas. In a scan where garnet contacts biotite, you find XMg = 0.310, XFe = 0.690 for Garnets; and XMg = 0.606, XFe = 0.324 for Biotite. Find the Pressure and Temperature Calculate KD then draw in a Garnet-Biotite line Calculate Pressures in Kilobars for 400 and 700C 1000 bar = 1 kilobar Draw in the GASP Line Crossing Point gives the P-T conditions