Download
1 / 23
230 likes | 370 Views
Fatigue Performance of High Strength Riser Materials RPSEA Project No. DW 1403 PWC Web Meeting November 6, 2009 Prepared by Stephen J. Hudak, Jr. and James H. Feiger Materials Engineering Department Southwest Research Institute. Research Partnership to Secure Energy for America.

E N D
Fatigue Performance of High Strength Riser Materials RPSEA Project No. DW 1403 PWC Web Meeting November 6, 2009 Prepared by Stephen J. Hudak, Jr. and James H. Feiger Materials Engineering Department Southwest Research Institute Research Partnership to Secure Energy for America
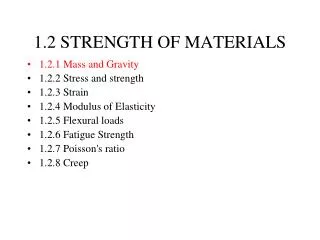
Meeting Objective • Review variable frequency test data • Select test protocol for future testing • Fatigue Crack Growth Rates (FCGR) • Classical S-N fatigue life
Materials MaterialYS: min/measSourStatus 1 110/123 ksi yes frequency-scan complete; Fatigue testing underway 2 125/137 ksi yes frequency-scan complete Fatigue testing underway 3 125/134 ksi yes Received material this quarter; Specimen machining complete Frequency-scan complete 4 125/132 ksi no frequency-scan complete; Fatigue testing underway. 5 125/163 ksi no Frequency-scan complete; Fatigue testing underway 6 114 ksi yes S-N specs. Machined Freq-Scan tests underway
Environments • Lab air (baseline): 70-75°F, 40-60% RH • Seawater: ASTM D1141 substitute ocean water open to the air with cathodic protection: - 1050mv vs. Saturated Calomel Electrode • Sour Brine: Production brine with oxygen below 10 ppb and 35% H2S + 65% CO2
Region II Classical Freq. Effect Region I Inverse Freq Effect Background: Freq. Dependence Complex at Low DK Mod 4130 Steel: YS=98ksi Sour Environment
Inverse Freq. Effect at Low DK Due to Corrosion-Product Wedging d=1/p(Kmax/E sys)2
123 ksi Steel in SW+CP vs. Lab Air Frequency Schedule 1
123 ksi Steel in SW+CP vs. Lab Air Frequency Schedule 2
123 ksi Steel in SW+CP vs. Lab Air Schedule 1vs Schedule 2
123 ksi Steel in Sour Brine vs. Lab Air Frequency Schedule 1
123 ksi Steel in Sour Brine vs. Lab Air Frequency Schedule 2
123 ksi Steel in Sour Brine vs. Lab Air Schedule 1vs Schedule 2
Test Frequency Options • Replicate tests using Frequency Schedule 1 • Advantage: closest to service conditions • Disadvantage: may be non-conservative, and increases test duration • Replicate tests using Frequency Schedule 2 • Advantage: provides conservative results, and decreases test duration • Disadvantage: may not be best representation of riser loading frequency – i.e. damage may be too conservative • One test each at Frequency Schedules 1 and 2 • Advantage: Defines effect of frequency on fatigue damage • Disadvantage: no test replication
Project Schedule • Complete FCGR testing: 4-6 months • Complete S-N testing: 12-14 months • Total Material-Envirs. 9 (including added sour tests • Completed Mat-Envirs. 1 • Remaining Mat-Envirs. 8 • Remaining machine time: 48 Months • Remaining calendar time: 12-14 months (4 test machines)
Other Issues 1. Higher strength materials exhibiting signs of SCC in both sour brine and SW+CP • Recommend adding selected SCC tests • Formulating Workscope and cost estimate for SCC testing 2.Need to add funding for additional sour brine testing identified at kick-off meeting • Total cost = testing cost – savings on air tests being conducted at NETL • Formulating workscope and cost estimate for these addition sour brine tests. • Source of cost sharing: donated materials?
Seawater vs. Sour Brine Seawater YS = 132 ksi SourBrine 15X 250X
Frequency Scan Testing Seawater • Corrosion fatigue performance sensitive to loading frequency • Fatigue crack growth rates at constant-DK used to characterize frequency effect in frequency scan (FS) tests 13x
Seawater vs. Sour Brine Seawater YS = 114 ksi Sour Brine 6X 24X
Frequency Response vs. YS Sour Brine Seawater Air Baseline Air Baseline
Material-Environment Interactions Corrosion-Fatigue Acceleration* vs. Air Baseline Yield Strength, ksi 114 131 132 Environment: Sour Brine Seawater 24X 250X --- 6X 15X 15X * At DK= 20 ksi√in. R=0.5 and Frequency = 0.01 Hz