Download
1 / 31
320 likes | 560 Views
What? How many? Where?. When? Who? Why? How to overcome?. Dimensions and Characteristics of Poverty and Malnutrition. I. Definitions and Measurement (What and How Many?). Defining and Measuring Poverty and Malnutrition B. Counting the Poor and Malnourished.

E N D
What? How many? Where? When? Who? Why? How to overcome? Dimensions and Characteristics of Poverty and Malnutrition
I. Definitions and Measurement(What and How Many?) Defining and Measuring Poverty and Malnutrition B. Counting the Poor and Malnourished
I.A. Defining and Measuring Poverty and Malnutrition I.A.1. Poverty I.B.2. Malnutrition
I.A.i. Defining and Measuring Poverty Or, How did we get $1.00 a day? and What does that mean?
World Bank, World Development Report, 1990 • Poverty: “the inability to attain a minimal standard of living” (p.26) • This raises three questions: • How do you measure the standard of living? • What do you mean by minimal standard? • How do you express the overall severity of poverty in a single measure?
Measuring the Standard of Living • “Household income and expenditures per capita are adequate yardsticks for the standard of living, as long as they include ownproduction…” WB, WDR, 1990. P.26 • But they do not include such other dimensions of welfare as health, life expectancy, literacy, and access to public goods or common property resources (e.g., clean water, free public services), so complementary measures are needed.
Defining the Minimal Standard of Living • The minimal standard is expressed as a “poverty line” based on two elements: 1. “the expenditure necessary to buy a minimum standard of nutrition and other basic necessities and 2. a further amount that varies from country to country, reflecting the cost of participating in the everyday life of society.” WB, WDR, 1990, p.26
Estimating The International Poverty Line - World Bank 1990 • Review official national poverty lines of 33 poor countries derived in mid-1980s • Scale all to 1985 with consumer price indices • Convert with “Purchasing Power Parity” conversion factor so, e.g., one dollar’s worth of rupees buys the same “basket of goods” in India as one dollar’s worth pesos in Mexico • Choose international poverty line based on [“eyeballing”?] poverty lines of poorest eight
Finding the International Poverty LinePPP $/cap/yr (WB, WDR, 1990, p. 27)
International Poverty LinesWorld Bank Estimates • 1990 estimate: $1.02/day/person in 1985 prices converted with Purchasing Power Parity • 1999 estimate: $1.08 in 1993 prices converted with PPP (median of 10 poorest countries) • Upper poverty line of $2.00 • The lower the line, the fewer people classified as poor
Critiques of World Bank Estimates of International Poverty Line • Basket of goods for PPP does not reflect what the poor buy • Poor pay higher prices • Changes in PPP as global development proceeds tend to decrease poverty lines in poor countries • Results: underestimate number of poor; and show an erroneously favorable trend in poverty reduction Source: Reddy and Pogge. 2003. “How NOT to Count the Poor.” www.socialanalysis.org
Human Development Index (HDI):U.N. Development Programme (UNDP) • “Measures the average achievement in a country in three basic dimensions of human development: • A long and healthy life … • Knowledge … • A decent standard of living …” Source: UNDP. 2003. Human Development Report, Technical Notes, p. 141
Measuring The HDI: Indicators And Indices • A long and healthy life: life expectancy • Knowledge: adult literacy (2/3 weight) and enrollment [all levels] ratio (1/3 weight) • A decent standard of living: Gross Domestic Product per capita • Convert each to an index (0 - 1) based on “goalpost” maxima and minima; sum and divide by 3. Max is 1.00.
HDI: Albania Example • Life expectancy is 73.5 years. Goalposts are 25 and 85. • (73.4-25) / (85-25) = .807 • Knowledge index = .798 • GDP Index = .602 • HDI = (.807+.798+.602) / 3 = .735 (95th)
U.S. Poverty Threshold • Three times expenditure for low-cost, nutritionally adequate diet • Created in 1963 by Mllie Orshansky of the Social Security Administration • Based on: (a) USDA “Economy Food Plan” designed for emergency use when funds are low; and (b) USDA Household Food Consumption Survey showing that in 1955 families of 3 spent 1/3 of their after-tax income on food
Family Size* 1 2 3 4 8 *Exact threshold depends on family composition 48 Contiguous States $ 8,825 - 9,573 11,122 - 12,682 14,393 - 14,824 18,660 - 19,979 30,619 - 33,876 U.S. Poverty Thresholds 2003Source: U.S. Census Bureau at http://www.census.gov/hhes/poverty/threshld/thresh03.html
Mollie Orshansky (1971) created U.S. Poverty Threshold in 1963. She considered it a measure of income inadequacy.
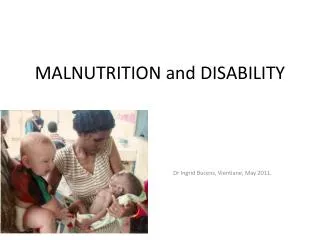
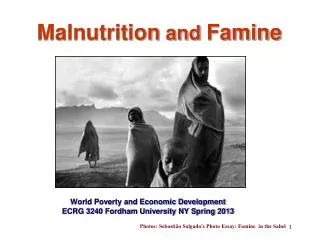
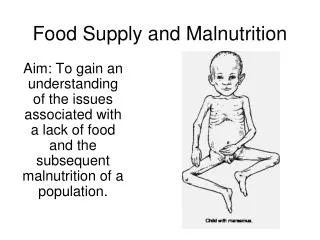
I.A.2. Defining and Measuring Malnutrition The biology of malnutrition Food security Malnourished children
Food Security “Access…at all times to enough food for an active healthy life.” Source: Reutlinger in Foster, p. 95
How FAO Counts the Undernourished in a Country (1) • Estimate total calories available in country from production, trade, and stocks • Divide by population to get average dietary energy supply (DES) • Estimate minimum energy requirements for good health for each age, sex, status group. • Aggregate into energy requirement for average individual based on percent of population in each group.
How FAO Counts the Undernourished (2) 5. Estimate distribution of energy consumption based on (a) mean DES; (b) Gini coefficient of income inequality and; (c) log normal model distribution 6. Calculate percent of population below minimum 7. Multiply by population to get number undernourished.
Lorenz Curves for U.S. Show Increasing Income Inequality1970 - 1994years 1970, 1980, 1990, 1994colors:black greenblue redCoefficients: .39; .40; .43; .46
FAO: Energy Requirement • (FAO/WHO/UNU, 1985), has defined energy requirements as follows: The energy requirement of an individual is the level of energy intake from food that will balance energy expenditure when an individual has a body size and composition and level of physical activity, consistent with long-term good health; and that will allow for the maintenance of economically necessary and socially desirable physical activity. In children and pregnant or lactating women the energy requirement includes the energy needs associated with the deposition of tissues or the secretion of milk at rates consistent with good health.
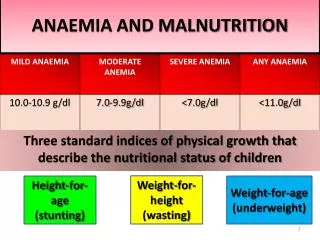
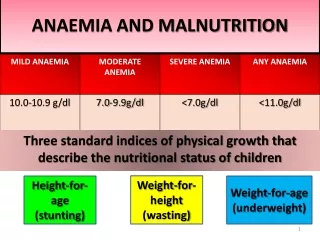
Stunted Children as an Indicator • In children under 5, height is determined mainly by nutrition, not genetics • Stunting highlights major outcome problem - diminished physical and mental capacity • Reflects long-term poverty • Reflects care and health as well as food availability • Care may be a function of culture as well as poverty • Misses short-term changes