Download
1 / 1
10 likes | 272 Views
predicted. predicted. predicted. observed. observed. observed. Supplementary figure. A. B. C. GRACE. GRACE + NT-proBNP. GRACE + GDF-15. 0.25. 0.25. 0.25. 0.20. 0.20. 0.20. Risk of 6 month death or MI. 0.15. 0.15. 0.15. 0.10. 0.10. 0.10. 0.05. 0.05. 0.05. 0. 0. 0.

E N D
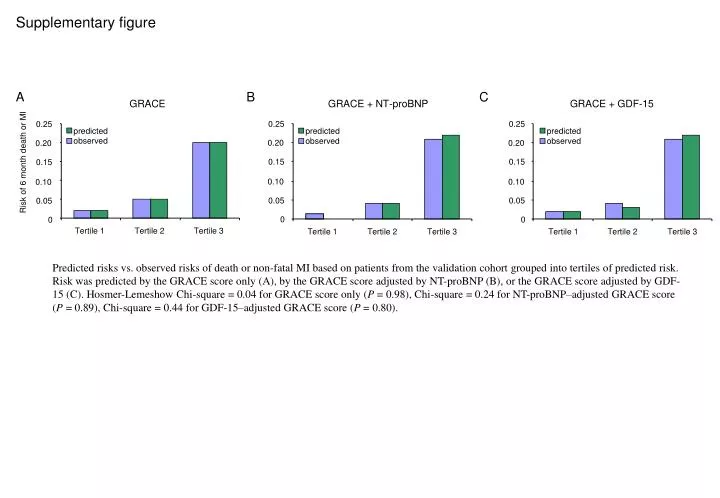
predicted predicted predicted observed observed observed Supplementary figure A B C GRACE GRACE + NT-proBNP GRACE + GDF-15 0.25 0.25 0.25 0.20 0.20 0.20 Risk of 6 month death or MI 0.15 0.15 0.15 0.10 0.10 0.10 0.05 0.05 0.05 0 0 0 Tertile 1 Tertile 2 Tertile 3 Tertile 1 Tertile 2 Tertile 3 Tertile 1 Tertile 2 Tertile 3 Predicted risks vs. observed risks of death or non-fatal MI based on patients from the validation cohort grouped into tertiles of predicted risk. Risk was predicted by the GRACE score only (A), by the GRACE score adjusted by NT-proBNP (B), or the GRACE score adjusted by GDF-15 (C). Hosmer-Lemeshow Chi‑square = 0.04 for GRACE score only (P = 0.98), Chi‑square = 0.24 for NT-proBNP–adjusted GRACE score (P = 0.89), Chi‑square = 0.44 for GDF-15–adjusted GRACE score (P = 0.80).