Download
1 / 26
300 likes | 632 Views
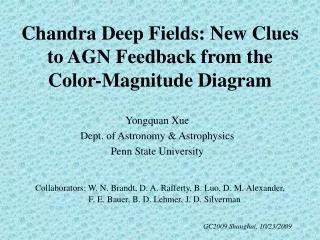
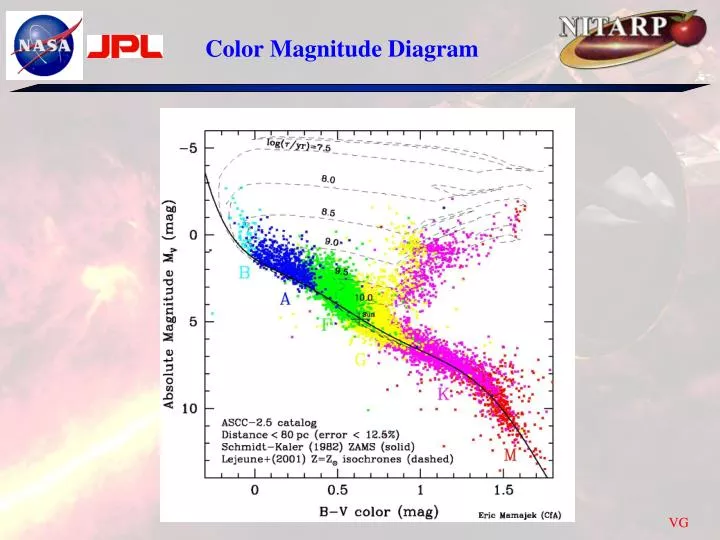
Color Magnitude Diagram. So we want a color magnitude diagram for AGN so that by looking at the color of an AGN we can get its luminosity But AGN have no fusion, why would we expect a color-magnitude relation?

E N D
So we want a color magnitude diagram for AGN so that by looking at the color of an AGN we can get its luminosity • But AGN have no fusion, why would we expect a color-magnitude relation? • The gas that accretes onto the black hole is still hot and so must follow the Blackbody Radiation law.
So we want a color magnitude diagram for AGN so that by looking at the color of an AGN we can get its luminosity • But AGN have no fusion, why would we expect a color-magnitude relation? • The gas that accretes onto the black hole is still hot and so must follow the Blackbody Radiation law. • If this is so obvious, why hasn’t it been done before? • Well it has but to no great success • So why are we trying again? • Possibly not a large enough sample, not enough wavelengths to avoid emission lines, and AGN are variable • We have new data covering a much wider wavelength range and with better sensitivity
GALEX data • To study UV in general and to study it in AGN specifically, the Galaxy Evolution Explorer (GALEX) satellite was launched in 2003. • It operates in two bands at 1528 angstroms (FUV) and 2271 angstroms (NUV) • Better resolution and than any previous UV mission: 4.3” at FUV and 5.3” at NUV. • Better sensitivity than any previous UV mission • AGN are bright in the UV and because of that also towards the color blue in the optical. This is called the blue excess that was detected early in the history of AGN and is used as a sign that a galaxy has an AGN.
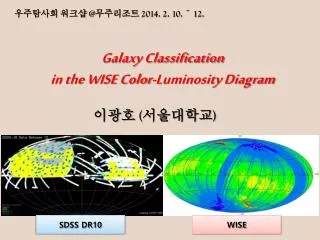
SDSS • The Sloan Digital Sky Survey or SDSS is a major multi-filter imaging and spectroscopic redshift survey using a dedicated 2.5-m wide-angle optical telescope at Apache Point Observatory in New Mexico • Data collection began in 2000, and the final imaging data release covers over 35% of the sky • The survey has photometric observations of around 500 million objects and spectra for more than 1 million objects
Using templates like the ones below, SDSS has classified objects into different types of AGN