Download

1 / 39
390 likes | 502 Views
Microsoft Access 2007 Tutorial (Part II). CIS*1000*DE. (sigh)… Before We Get Started. Last time we learned about Tables and Queries . This time we’re going to learn about: The Expression Builder Reports But first we’re going to need some data, so… Download “example.mdb” from…

E N D
Microsoft Access 2007 Tutorial(Part II) CIS*1000*DE
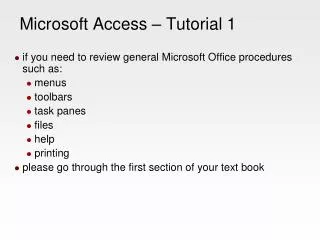
(sigh)…Before We Get Started • Last time we learned about Tables and Queries. • This time we’re going to learn about: • The Expression Builder • Reports • But first we’re going to need some data, so… • Download “example.mdb” from… http://www.uoguelph.ca/~jizhu/CIS1000DE/tutorials.shtml • …and save it to the Desktop.
example.mdb • Open up “example.mdb” • This Database contains 2 Tables and 4 Queries: People Sales Queries People ID Sale ID All Sales Made Last Name Product Name Brand Name Sales First Name Brand Name MinimumAge Age Price Birth Date Quantity Only Blue Eyes Eye Colour People ID
example.mdb cont’d • A quick note about MS Access 2007… • When you first open up example.mdb, you will in all likelihood see just the queries. • To switch between viewing the tables and the queries simply click on the down arrow on the left hand tab section and select “Tables” or “Queries”
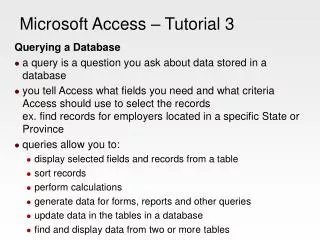
example.mdb cont’d • The “All Sales Made” query… • Displays information about every single sale that’s been made. • The “Brand Name Sales” query… • Displays the total number of each brand name item sold for each type of product. • The “Minimum Age” query… • Asks the user to input a minimum age and then displays the people who are at least that age or older. • The “Only Blue Eyes” query… • Only displays information about people who have blue eyes.
The Expression Builder • Open up the “All Sales Made” query and switch into Design View. • Take a look at the last two fields, “Price” & Quantity” • It stands to reason that if we know the price of an item and how many were sold, then we could calculate the amount of revenue that was made. (Price) x (Quantity) = Revenue • But how do we do this in MS Access? “Price” and “Quantity” are two separate fields. How do we multiply them together to get the Revenue?
The Expression Builder cont’d • The Solution? The Expression Builder! • To use the Expression Builder, we must first select an empty field in our query in Design View. • Now take a look at the at the top of the screen under the Design tabfor the expression builder button
The Expression Builder cont’d • You will get something that looks like this:
The Expression Builder cont’d • Type in “Revenue:” The word “Revenue” will become the name of the new field that we are creating. The Semicolon “:” is used to indicate the end of the Field Name and the beginning of the Expression.
The Expression Builder cont’d • Now,double-click on “Price” & “Quantity” • You should notice that those fields have now been added to our expression.
The Expression Builder cont’d • Remove all the “<<Expr>>”that appear in b/t. • Add a “ * ” between [Price] and [Quantity]. • Your finished expression should look like: Revenue: [Price] * [Quantity] • Click OK to get out of the Expression Builder. • Save the query (*this is important!) • Switch into Datasheet View
Limiting the Query Results • Now, what if we only wanted to know the five largest purchases that have been made? • Switch into Design View • Sort the query in Descending order according to the “Revenue” field. • Now, take a look at the Design tabat the top of the screen and look for “Return” • Select 5
Limiting the Query Results cont’d • Save the query. • Switch into Datasheet View • Notice how only the 5 largest sales are being displayed.
Other Built-In Functions • MS Access contains many built-in functions. • For example, the “Month( )” function extracts the month from a given date. • Similarly, the “Day( )” function extracts the day from a given date, and the “Year( )” function extracts the year from a given date. • To illustrate these examples, we’re going to create a new query that extracts the Month from a given Birth Date.
Other Built-In Functions cont’d • Create a new query in Design View. • Add the “People” table. • Add the “First Name” & “Birth Date” fields. • Click on an empty field and then click on the Expression Builder button. • Type in, Month: Month( ) • Make sure that the cursor is in between the brackets.
Other Built-In Functions cont’d • Double-click on the “Tables” folder, click on the “People” table, and then double-click on the “Birth Date” field. • You should have an expression that looks like this: Month: Month([People]![Birth Date])
Other Built-In Functions cont’d • Click OK to exit the Expression Builder. • Save the query. • Switch into Datasheet View • Notice that the month that’s being displayed in “Month” field is the same as the month in the “Birth Date” field.
What’s a Report? • A report presents the data in a table or query in an attractive fashion on the printed page. • Reports are an effective way to present your data in a printed format. • You have control over the size and appearance of everything on a report and you can display the information any way that you want to see it.
Creating a Report • Before we create a report, let’s switch to the Reports section on the left-hand tab • To switch to Reports simply click on the down arrow on the left hand tab section and select “Reports”
Creating a Report cont’d • Click on the Create tab • Select Report Wizard
Creating a Report cont’d • We’re going to create a report based on data from the “People” table. • So, click and scroll - down until you find: “Table: People”
Creating a Report cont’d • Add the “People ID”,“Last Name”, “First Name”, “Age”, & “Eye Color” fields by either double-clicking on them or by selecting them and then using the button.
Creating a Report cont’d • Click on Next • Double-click on “Last Name” to select it as our first grouping level
Creating a Report cont’d • Click on Next. • This screen allows you to sort the data for the report. Ascending Descending • Sort the report in Descending Order According to Age
Creating a Report cont’d • Click on Next. • This screen allows you to select a default layout and page orientation. • Select Stepped Layout. • Select Portrait Orientation. • Click on Next.
Creating a Report cont’d • This screen allows you to choose a default style for your report. • Select Office. • Click on Next. • Name our report: “Personal Information” • Click on Finish. (A preview is presented in the next slide) • Now we can see what our report looks like. Yay! • But what if we’re not happy with the way it looks? How can we edit the report? Design View
Recall • The report is grouped by Last Name • The report is then sorted in descending order by Age
Report – Design View cont’d • Report Header • displayed only on the first page. • Page Header • displayed at the top of each page. • Last Name Header • formatting for the “Last Name” grouping level. • Details • this section is printed repeatedly, once for each row of data in the underlying table / query.
Report – Design View cont’d • Page Footer • displayed at the bottom of each page. • Report Footer • displayed on only the lastpage.
Report – Design View cont’d • We can change the formatting and rearrange the fields. • Drag the textboxes around in the Page Header and in the Detail sections so that the “First Name”field is displayed before the “Age” field.
Report – Design View cont’d • You can change the appearance of each textbox. For example… • Right-click on “People ID” in the Details section. • Select Properties.
Report – Design View cont’d • Scroll down until you find Text Align. • Click on it, scroll down and select “Center”. • This will center all the People ID numbers in the report. • To verify that this worked simply switch back to Report View.
Report - Design View cont’d • Now, switch back into Design View. • Right-click on “People ID” in the Page Header section and select Properties. • Change the Text Align to “Center”. • This will center the “People ID” page header name. • Switch into Report View • Our report is now looking a little nicer / organized. • So, in short, there are lots of properties that you can play around with to manipulate the appearance of the report. Enjoy!
Importing Data from MS Excel • Click on the External Data tab • Select the Excel Button
Importing Data from MS Excel cont’d • Type in the location of the Excel file to import or find it by clicking on the browse button and searching for it. • Select the “Import the source data into a new table in the current database” option. • Follow the steps in the Import Spreadsheet Wizard and along the way make sure that… • “First row contains column headings” is checked off • You have manually chosen the Primary Key • The table has an appropriate title
No More Access! • As usual, if you have any questions, come to our office hours or post a question to the online conferences.