Download
1 / 12
120 likes | 172 Views
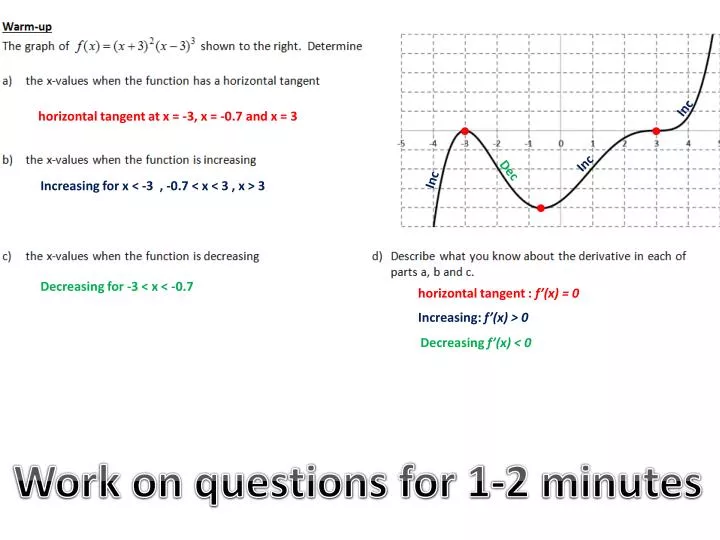
Inc. horizontal tangent at x = -3, x = -0.7 and x = 3. Inc. Dec. Inc. Increasing for x < -3 , -0.7 < x < 3 , x > 3. Decreasing for -3 < x < -0.7. horizontal tangent : f’(x) = 0. Increasing: f’(x) > 0. Decreasing f’(x) < 0. Work on questions for 1-2 minutes.

E N D
Inc horizontal tangent at x = -3, x = -0.7 and x = 3 Inc Dec Inc Increasing for x < -3 , -0.7 < x < 3 , x > 3 Decreasing for -3 < x < -0.7 horizontal tangent : f’(x) = 0 Increasing: f’(x) > 0 Decreasing f’(x) < 0 Work on questions for 1-2 minutes
4.1 Increasing and Decreasing FUnctions • Identify properties of a graph including intervals of increase and decrease, turning points, points of inflection and asymptotes. • Identify the intervals of increase and decrease and the turning points of a function. • Use the turning points and intervals of increase and decrease to graph a function. Please read these
the y-values increase which means f’(x) > 0 the y-values decrease which means f’(x) < 0 f’(x) = 0 the function switches from increasing to decreasing or decreasing to increasing. find where f’(x) = 0 and where f’(x) is undefined. Create an interval chart for the derivative using these values. Please copy
Identify the intervals of increase and decrease and the turning points of a function. • Use the turning points and intervals of increase and decrease to graph a function. Example 1: Finding Intervals of Increase/Decrease from an equation (Interval Chart) Determine the intervals of increase and decrease for . Solution is on the next slide On your own: 1) calculate the derivative 2) find when f’(x) = 0 or where f’(x) is undefined 3) create an interval chart (if you remember how to)
Determine the intervals of increase and decrease for . calculate the derivative Therefore is a factor. Synthetic division Finish factoring with decomposition and common factoring Summarize Continued on next slide
Create an interval chart using the derivative and the x values x = 1 and x = -5/4. Intervals Each factorof the derivative If the derivative is positive the function increases If the derivative is negative the function decreases Intervals of increase: Intervals of decrease: and
Identify the intervals of increase and decrease and the turning points of a function. • Use the turning points and intervals of increase and decrease to graph a function. Example 2: Using an interval chart to identify local minimums and maximums Using your interval chart from question 1 , determine the coordinates of all points where f’(x) = 0 and classify these points as local minimums, local maximums or neither.Sketch your results Solution is on the next slide On your own: 1) look at the interval chart and find where the function switched from inc to dec OR dec to inc. 2) decide each time f’(x) = 0 if the point is a max, min or neither. 3) find the y=coordinates of all the point where f’(x) = 0, also find the y-intercept. Sketch the graph.
Using your interval chart from question 1 , determine the coordinates of all points where f’(x) = 0 and classify these points as local minimums, local maximums or neither.Sketch your results From last question, Do not recopy at x = -5/4 the function switched from increasing to decreasing. Since f’(x) = 0 at this point, this point is a local maximum. at x = 1the function does not switch directions. Since f’(x) = 0 at this point, this point is neither a minimum nor a maximum but is just a horizontal tangent location. Substituting the x-values into the original equation the points are The y-intercept is (0,4) Graph on next slide
Identify the intervals of increase and decrease and the turning points of a function. • Use the turning points and intervals of increase and decrease to graph a function.
Identify the intervals of increase and decrease and the turning points of a function. • Use the turning points and intervals of increase and decrease to graph a function. Example 3: More intervals of Increase and Decrease – Rational functions Determine the intervals of increase and decrease for . Determine the coordinates of local minimums and maximums. Solution is on the next slide On your own: 1) calculate the derivative 2) find when f’(x) = 0 or where f’(x) is undefined 3) create an interval chart 4) find the coordinates of the minimums and maximums
Determine the intervals of increase and decrease for . Determine the coordinates of local minimums and maximums. calculate the derivativewith quotient rule Simplify the derivative Summarize the derivative is zero for values of x that make the numerator equal 0 but that do not make the denominator equal to 0 (the derivative is undefined for values x that make the denominator equal to 0.) Continued on next slide
Create an interval chart using the derivative and the x values x = 0, 1 and 2. Intervals of increase: Intervals of decrease: and At x = 0 the function shifts from increasing to decreasing. Since f’(x) = 0 at this point, f(0) = 0 is a local maximum. At x = 1 there is a vertical asymptote. At x = 2 the function shifts from decreasing to increasing. Since f’(x) = 0 at this point, f(2) = 4 is a local minimum.