Download
1 / 1
30 likes | 98 Views
Hydrography of Apalachicola Bay. Name One, Name Two, Name Three, Name Four. Abstract

E N D
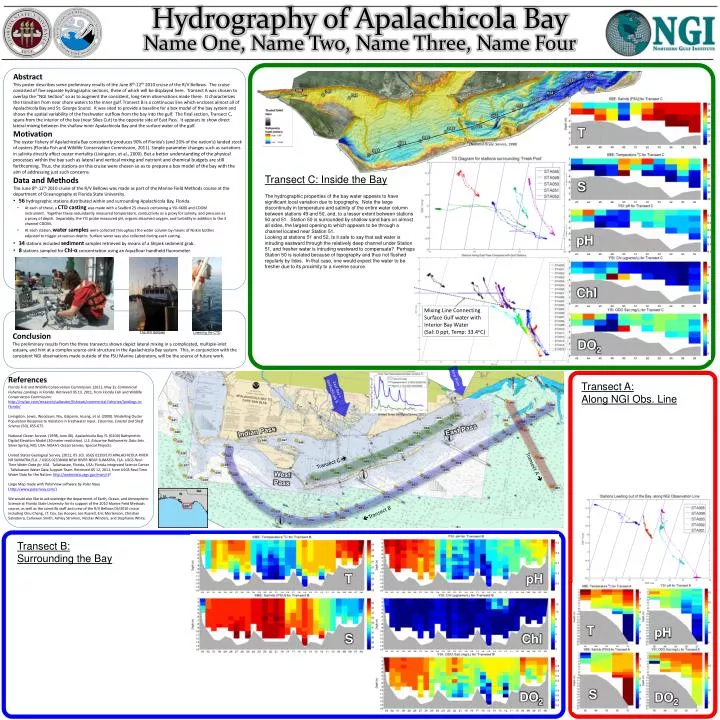
Hydrography of Apalachicola Bay Name One, Name Two, Name Three, Name Four • Abstract • This poster describes some preliminary results of the June 8th-12th 2010 cruise of the R/V Bellows. The cruise consisted of five separate hydrographic sections, three of which will be displayed here. Transect A was chosen to overlap the “NGI Section” so as to augment the consistent, long-term observations made there. It characterizes the transition from near shore waters to the inner gulf. Transect B is a continuous line which encloses almost all of Apalachicola Bay and St. George Sound. It was sited to provide a baseline for a box model of the bay system and shows the spatial variability of the freshwater outflow from the bay into the gulf. The final section, Transect C, spans from the interior of the bay (near Sikes Cut) to the opposite side of East Pass. It appears to show direct lateral mixing between the shallow inner Apalachicola Bay and the surface water of the gulf. • Motivation • The oyster fishery of Apalachicola Bay consistently produces 90% of Florida’s (and 20% of the nation’s) landed stock of oysters (Florida Fish and Wildlife Conservation Commission, 2011). Simple parameter changes such as variations in salinity directly affect oyster mortality (Livingston, et al., 2000). But a better understanding of the physical processes within the bay such as lateral and vertical mixing and nutrient and chemical budgets are still forthcoming. Thus, the stations on this cruise were chosen so as to prepare a box model of the bay with the aim of addressing just such concerns. • Data and Methods • The June 8th-12th 2010 cruise of the R/V Bellows was made as part of the Marine Field Methods course at the department of Oceanography at Florida State University. • 56hydrographic stations distributed within and surrounding Apalachicola Bay, Florida. • 34 stations included sedimentsamples retrieved by means of a Shipek sediment grab. • 8 stations sampled for Chl-α concentration using an Aquaflour handheld fluorometer. 056 055 046 047 054 048 053 052 051 Niskin Bottles T 050 049 Sediment Grab 045 (National Ocean Service, 1998) CTD 044 043 Transect C: Inside the Bay S The hydrographic properties of the bay water appears to have significant local variation due to topography. Note the large discontinuity in temperature and salinity of the entire water column between stations 49 and 50, and, to a lesser extent between stations 50 and 51. Station 50 is surrounded by shallow sand bars on almost all sides, the largest opening to which appears to be through a channel located near Station 51. Looking at stations 51 and 52, Is it safe to say that salt water is intruding eastward through the relatively deep channel under Station 51, and fresher water is intruding westward to compensate? Perhaps Station 50 is isolated because of topography and thus not flushed regularly by tides. In that case, one would expect the water to be fresher due to its proximity to a riverine source. • At each of these, a CTD castingwas made with a SeaBird 25 chassis containing a YSI-6600 and CDOM instrument. Together these redundantly measured temperature, conductivity as a proxy for salinity, and pressure as a proxy of depth. Separately, the YSI probe measured pH, organic dissolved oxygen, and turbidity in addition to the 3 channel CDOM. • At each station, water samples were collected throughout the water column by means of Niskin bottles adjusted to trigger at various depths. Surface water was also collected during each casting. pH New River East Bay + Apalachicola R. Chl Lowering the CTD The R/V Bellows Mixing Line Connecting Surface Gulf water with Interior Bay Water (Sal: 0 ppt, Temp: 33.4oC) Transect C Transect A Conclusion The preliminary results from the three transects shown depict lateral mixing in a complicated, multiple-inlet estuary, and hint at a complex source-sink structure in the Apalachicola Bay system. This, in conjunction with the consistent NGI observations made outside of the FSU Marine Laboratory, will be the source of future work. DO2 Transect B References Florida Fish and Wildlife Conservation Commission. (2011, May 3). Commercial Fisheries Landings in Florida. Retrieved 05 13, 2011, from Florida Fish and Wildlife Conservation Commission: http://myfwc.com/research/saltwater/fishstats/commercial-fisheries/landings-in-florida/ Livingston, Lewis, Woodsum, Niu, Galperin, Huang, et al. (2000). Modelling Oyster Population Response to Variation in Freshwater Input. Estuarine, Coastal and Shelf Science (50), 655-672. National Ocean Service. (1998, June 06). Apalachicola Bay, FL (G100) Bathymetric Digital Elevation Model (30 meter resolution). U.S. Estuarine Bathymetric Data Sets . Silver Spring, MD, USA: NOAA's Ocean Service, Special Projects. United States Geological Survey. (2011, 05 10). USGS 02359170 APALACHICOLA RIVER NR SUMATRA,FLA. / USGS 02330400 NEW RIVER NEAR SUMATRA, FLA. USGS Real-Time Water Data for USA . Tallahassee, Florida, USA: Florida Integrated Science Center - Tallahassee Water Data Support Team. Retrieved 05 12, 2011, from USGS Real-Time Water Data for the Nation: http://waterdata.usgs.gov/nwis/rt? Large Map made with PolarViewsoftware by Polar Navy (http://www.polarnavy.com/) We would also like to acknowledge the department of Earth, Ocean, and Atmospheric Science at Florida State University for its support of the 2010 Marine Field Methods course, as well as the scientific staff and crew of the R/V Bellows 06/2010 cruise including Chiu Cheng, J.T. Cox, Jay Hooper, Lee Russell, Eric Mortenson, Christian Salvaterra, Carlowen Smith, Ashley Stroman, Nicolas Winders, and Stephanie White. Transect A: Along NGI Obs. Line (United States Geological Survey, 2011) East Pass Indian Pass West Pass Transect B: Surrounding the Bay T pH T pH S Chl S DO2 DO2