Download
1 / 24
240 likes | 313 Views

E N D
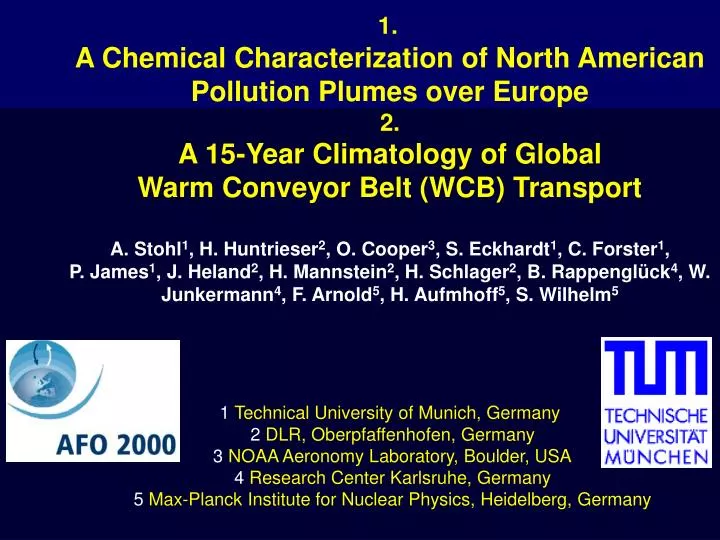
1.A Chemical Characterization of North American Pollution Plumes over Europe2.A 15-Year Climatology of GlobalWarm Conveyor Belt (WCB) TransportA. Stohl1, H. Huntrieser2, O. Cooper3, S. Eckhardt1, C. Forster1,P. James1, J. Heland2, H. Mannstein2, H. Schlager2, B. Rappenglück4, W. Junkermann4, F. Arnold5, H. Aufmhoff5, S. Wilhelm51 Technical University of Munich, Germany2 DLR, Oberpfaffenhofen, Germany3 NOAA Aeronomy Laboratory, Boulder, USA4 Research Center Karlsruhe, Germany5 Max-Planck Institute for Nuclear Physics, Heidelberg, Germany
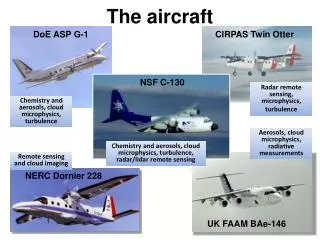
Part 1:Aircraft measurements during CONTRACEStohl et al., submitted to J. Geophys. Res. Aim of the first campaign in November 2001: To study the role of WCBs for intercontinental pollution transport Due to successful model forecasts, 3 North American plumes were encountered 3 cases were quite similar, only 1 case presented here
Tracer simulations using FLEXPART FLEXPART is a Lagrangian particle dispersion model no chemistry, only transport 3 carbon monoxide emission tracers (EDGAR) Asia Europe North America Stratospheric ozone tracer
Transport of North American CO tracer 13 November 2001: Accumulation of pollution in high-pressure system over North America FLEXPART total column of CO tracer GOES-East IR satellite image
Transport of North American CO tracer 15 November 2001: A low forms and opens an export pathway to the east in its warm sector: transport over high-emission regions FLEXPART total column of CO tracer GOES-East IR satellite image
Transport of North American CO tracer 17 November 2001: Cold front pushes pollution to the Atlantic Tracer plume and clouds are aligned in WCB Lifting to free troposphere FLEXPART total column of CO tracer GOES-East IR satellite image
Transport of North American CO tracer 18 November 2001: Pollution plume in the WCB outflow in the upper troposphere FLEXPART total column of CO tracer METEOSAT + GOES-East 5-day trajectories that ascend more than 5000 m during last 4 days
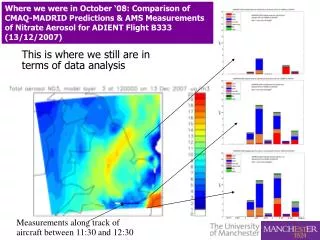
Transport of North American CO tracer 19 November 2001: Pollution plume arrives over Europe FLEXPART total column of CO tracer METEOSAT + GOES-East Falcon flight track
Meridional section through North America CO tracer along the flight track Northbound flight Southbound flight Munich to Stockholm Stockhom to Munich
Model tracers interpolated to the flight track Stratospheric O3 tracer + measured O3 + measured humidity +altitude (black) Asia CO tracer + measured NOy (black) +measured NO Europe CO tracer + measured CO2 (black) North America CO tracer + measured CO (black)
Backward reconstruction of North American CO and NOy along flight track • About 600 individual FLEXPART simulations • every 200 m vertically • every 0.1° along the track • Advect unit mixing ratio backwards from aircraft position and calculate „residence times“ on a grid • Multiply with emissions from EDGAR and obtain concentration at flight track
North American CO and NOy along flight trackfrom 600 backward simulations EDGAR NOx + measured NOy (black) + measured NO EDGAR CO + measured CO (black) + aircraft altitude
FLEXPART backward simulation for peak at 11:53 UTC27 second interval Residence time in whole atmospheric column Residence time in footprint
FLEXPART backward simulations for peak at 11:53 UTC Source contribution (ppb per grid cell)
Conclusions from Part 1 • WCB transport is the key mechanism for fast intercontinental pollution transport • Many chemical species were enhanced in the observed plumes • CO • CO2 • NOy (but 90% were removed due to washout) • Ozone (even in November!) • Acetone • SO2 • Numerous hydrocarbons • Lagrangian backward modeling allows quantitative determination of source contribution and resolves very small-scale features Don´t use „cheap“ trajectories to interpret „expensive“ aircraft measurements! Stohl, A., S. Eckhardt, C. Forster, P. James, N. Spichtinger, and P. Seibert (2002): A replacement for simple back trajectory calculations in the interpretation of atmospheric trace substance measurements. Atmos. Environ. 36, 4635-4648 (October issue)
Part 2:A 15-Year WCB Climatology Eckhardt et al., in preparation for J. Climate Basis: • 360 million 6-day trajectories starting daily on a 1° x 1° global grid • ECMWF ERA-15 re-analysis data • WCB diagnosis by identifying trajectories that • ascend strongly and • travel northeastward during the first 48 hours
Frequency of WCB inflow: Strong contrasts between Northern and Southern Hemisphere: NH: maxima downwind of North America and Asia, winter maximum SH: less zonal variability, spring maximum
WCB transport 15-year climatology of WCB occurrence DAY 0
WCB transport 15-year climatology of WCB occurrence DAY 1
WCB transport 15-year climatology of WCB occurrence DAY 2
WCB transport 15-year climatology of WCB occurrence DAY 3
WCB transport 15-year climatology of WCB occurrence DAY 4
WCB transport 15-year climatology of WCB occurrence DAY 5
http://www.forst.tu-muenchen.de/EXT/LST/METEO/stohl/ Climate variability and intercontinental transport Example: Influence of the North Atlantic Oscillation on WCBs NAO + NAO – At day 0 At day 2