Download
1 / 80
810 likes | 982 Views
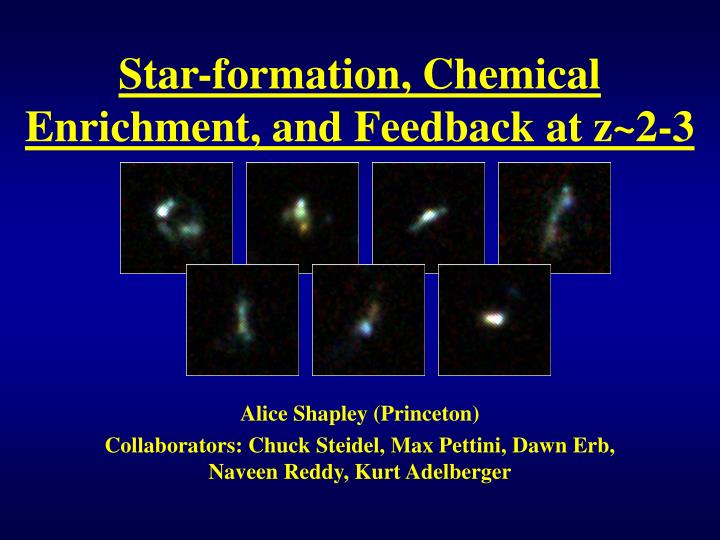
Star-formation, Chemical Enrichment, and Feedback at z~2-3. Alice Shapley (Princeton) Collaborators: Chuck Steidel, Max Pettini, Dawn Erb, Naveen Reddy, Kurt Adelberger. Overview and Motivation. UV-color-selected galaxies at z~1.5-3.0 (9-11 Gyr)

E N D
Star-formation, Chemical Enrichment, and Feedback at z~2-3 Alice Shapley (Princeton) Collaborators: Chuck Steidel, Max Pettini, Dawn Erb, Naveen Reddy, Kurt Adelberger
Overview and Motivation • UV-color-selected galaxies at z~1.5-3.0 (9-11 Gyr) • Lots of progress in understanding their global and detailed properties, their effects on the IGM • New results: • The origin of the ionizing background at z~3, direct spectroscopic measurement of ionizing radiation from galaxies at z~3, constraints on fesc,Jn ,G • Robust measurement of mass-metallicity relation at z~2. Plus: new info on physical conditions in star-forming regions at z~2, implications for inferred chemical abundances, nature of star-formation
z>2 color-selection • Adjust z~3 UGR crit. for z~2 (Adelberger et al. 2004) • Spectroscopic follow-up with optimized UV-sensitive setup (Keck I/LRIS-B) (Steidel et al. 2004)
Redshift Distributions LBG: z~3 (940) SLBG=1.7/arcmin2 nLBG=1.4x10⁻³Mpc-3 BX: z=2-2.5 (816) SBX=5.2/arcmin2 nBX=2.0x10⁻³ Mpc-3 BM: z=1.5-2.0 (118) SBM=3.8/arcmin2 nBM=1.7x10⁻³Mpc-3 750 gals at z=1.4-2.5 (Steidel et al. 2004; Adelberger et al. 2004) Unsmoothed BX/BM/LBG with R<=25.5
Redshift Distributions LBG: z~3 (940) SLBG=1.7/arcmin2 nLBG=1.4x10⁻³Mpc-3 BX: z=2-2.5 (816) SBX=5.2/arcmin2 nBX=2.0x10⁻³ Mpc-3 BM: z=1.5-2.0 (118) SBM=3.8/arcmin2 nBM=1.7x10⁻³Mpc-3 750 gals at z=1.4-2.5 (Steidel et al. 2004; Adelberger et al. 2004) Unsmoothed BX/BM/LBG with R<=25.5
Origin of the Ionizing Background • Major question: how did the universe transform from having a neutral to highly ionized IGM? • Many new observational results (SDSS QSOs, WMAP), plus theoretical work (i.e. predictions for future 21 cm telescopes) • Nature of the ionizing background important for understanding reionization and inferring physical properties of Lya forest • Measured with QSO “proximity effect”: current estimates J912~10-21erg/s/cm2/Hz/sr , G~10-12s-1 (Scott et al. 2000) • Questions: • What are relative contribution of QSOs & gals vs. z? (drop-off in QSO number density at high redshift) • What is fesc for galaxies???
Definitions of fesc • What is fesc? • fesc= Llyc,out/Llyc,in=exp(-tISM,lyc) • What is fesc,rel and why? • fesc,rel= fesc x (LUV,out/LUV,in)-1 =fesc x exp(tISM,UV) • Useful for deriving global quantities, such as J912,gal, based on LBG UV luminosity function • fesc,rel can be re-written: • fesc,rel= (LUV/Llyc)in/(FUV/Flyc)obs x exp(tIGM,lyc) Stellar pop. models:1.5-5.5 We measure this Simulations of z~3 IGM opacity in Lyc range
Search for Lyman-Continuum Emission • Lyman-Continuum Observations of Galaxies • z~0: HUT spectra at z~0, fesc<0.01-0.15 (Leitherer et al.) • z=1.1-1.7:HST/STIS UV imaging, fesc <0.01-0.06 (Malkan et al.) • z~3: LBG composite spectrum, fesc,rel>0.5, fesc~0.10 (Steidel et al.) • Controversy at z~3!! • HST/WFPC2 UBVi colors, fesc <0.04 (Fernandez-Soto et al.) • VLT spectra of 2 gals, fesc<0.02-0.03 (Giallongo et al. 2002) • NB imaging of 2 z>3 galaxies, fesc,rel <0.72 (Inoue et al. 2005)
Detection of Ly-C Emission? • Lyman Cont. Leakage • 29 gals at <z>=3.4+/-0.09 • Significant Ly-cont flux in composite spectrum 5 times more ionizing flux than QSOs at z~3 • Bluest quartile in (G-R)0, strong Lya emission, IS abs lines weaker than cB58: is it representative? • fesc different from local SB (Leitherer et al. 1995) (Steidel et al. 2001)
Search for Lyman-Continuum Emission • Lyman-Continuum Observations of Galaxies • z~0: HUT spectra at z~0, fesc<0.01-0.15 (Leitherer et al.) • z=1.1-1.7:HST/STIS UV imaging, fesc <0.01-0.06 (Malkan et al.) • z~3: LBG composite spectrum, fesc,rel>0.5, fesc~0.10 (Steidel et al.) • Controversy at z~3!! • HST/WFPC2 UBVi colors, fesc <0.04 (Fernandez-Soto et al.) • VLT spectra of 2 gals, fesc<0.02-0.03 (Giallongo et al. 2002) • NB imaging of 2 z>3 galaxies, fesc,rel <0.72 (Inoue et al. 2005)
New Ly-C Observations • Deep Keck/LRIS spectra for a sample of 14 objects • Red side: detailed obs of interstellar lines (17 hr, 2x resolution) • Blue side: sensitive observations of Lyman Continuum region (22 hr, 8 hr with New Blue Camera, 1.3x resolution) • Observations approach the quality of cB58, but larger sample • Deep Sample (bright LBGs): • <z>=3.06, <RAB>=23.92, <E(B-V)>=0.11, WLya=2Å (em/abs) • Steidel et al. Ly-cont sample: • <z>=3.40, <RAB>=24.33, <E(B-V)>=0.07, WLya=15Å • Composite Sample of Shapley et al. (811 galaxies w/ spectra): • <z>=2.96, <RAB>=24.60, <E(B-V)>=0.13, WLya=15Å
Examples of Deep LBG Spectra • LRIS-R spectra (LRIS-B covers Lya and Lyman continuum), 1-1.5Å res. • Use these spectra to measure physical properties of abs. lines; connect with UV-color, Lya, Lyman continuum
New Ly-C Observations • Main observational results: • Ionizing flux is detected for 2 out of 14 objects. Why? • F900/F1500 (i.e. Flyc/FUV) quite large for these two galaxies --> significant galaxy-to-galaxy variation in fesc? • Ratio of F900/F1500 in average spectrum is four times lower than that in Steidel et al. (2001)
Lyman limit, 912 AA 3350 AA 3950 AA Detections: 2D Spectra D3, z=3.07 Rs=23.37 Lyman limit, 912 AA C49, z=3.15 Rs=23.85 3350 AA 3950 AA
Detections: 1D Spectra • D3, double, z=3.07, Rs=23.37 F1500/F900=5.1 (7.1 if you add F1500 from both components), 15% uncertainty • Yet, IS lines are black! • Reddest galaxy in sample • IGM correction x3 (starts to strain stellar pop. models) Steidel et al. (2001) found <F1500/F900>=17.7, then corrected by factor of 3.8 for IGM opacity.
Lyman limit, 912 AA Lya 3710 AA 4950 AA Detections: SSA22a-D3 HST/NIC F160W D3 (z=3.07, Rs=23.37) is double, and upper brighter component appears to have significant flux below 912 Å Lots of additional info: near-IR imaging &spectra, HST, Lya blob
U R BV NB-excess 2” Matsuda et al. 2004 Detections: SSA22a-D3 P200 Rs HST/NICMOS F160W
Detections: 1D Spectra • C49, z=3.15, Rs=23.85 F1500/F900=12.7, 15% uncertainty • One of the bluest galaxies in the sample, with weakest IS lines (non-unity covering fraction), but others with even less, and no Lyman Cont. emission • IGM correction x3 Steidel et al. (2001) found <F1500/F900>=17.7, then corrected by factor of 3.8 for IGM opacity.
Detections: 1D Spectra • D3 has very young inferred age (<10 Myr), while age of C49 is unknown. Clear direction to estimate ages for entire sample (near-IR and IRAC photometry), as F900/F1500 is very age-dependent Steidel et al. (2001) found <F1500/F900>=17.7, then corrected by factor of 3.8 for IGM opacity.
Non-Detections: 1D Spectra C32, z=3.29, Rs=23.68 Weak IS lines (covering fraction smaller than in C49) C35, z=3.10, Rs=24.18
The Average Spectrum Stack 15 deep spectra, normalized by F1500 WLya=2Å (plus abs), WIS=2.2Å abs F1500/F900=65 (25% uncertainty), four times larger than S01 Systematics of sky subtraction VERY IMPORTANT, comparable to avg detection RMS 2.5 times lower than S01 (red curve)
The Average Spectrum Benefits of Averaging. Recover information bluewards of Lya, such as Lyman series (independent estimate of typical N(HI) ) Possibly molecular H Other metal lines
S01 result From Bolton et al. Implications • S01 measured <F1500/F900>=17.7, and applied a factor of 3.8 correction for z=3.4 IGM opacity -->F1500/F900,corr=4.6 • We now measure <F1500/F900>=65.5, and z=3 IGM correction factor is more like ~3 --> F1500/F900=22. So, we measure fesc,rel that is 4-5 times lower (~10%). • If F1500/F900 is representative (which we still need to establish), we can use it to convert LBG 1500 AA luminosity density into 912 AA luminosity function, and then from e(912) to J912 (and then to G) • If we scale S01 results for J912, we get 3x10-22 erg/s/cm2/Hz/sr, and G~8x10-13 s-1,which is more consistent with recent estimates (Bolton et al. 2005) of G(z=3) based on Lya forest optical depth
The Future • Understand ISM/outflow properties of sample (based on red-side data of interstellar absorption lines), try to connect to emergent Lyman continuum radiation • Understand spectroscopic sky-subtraction systematics • Compare with AGN contribution -- new value of J912 is comparable to that from QSOs (Hunt et al. 2004), but depends on fesc in faint QSOs • While we have a larger sample of deep z~3 spectra now, we are also trying to detect Lyman continuum in an independent manner: NB imaging just below the Lyman Limit (Inoue et al. 2005) • Special opportunity because of large structure of galaxies at z=3.09, unparalleled U-band sensitivity of LRIS-B
Redshift Distributions LBG: z~3 (940) SLBG=1.7/arcmin2 nLBG=1.4x10⁻³Mpc-3 BX: z=2-2.5 (816) SBX=5.2/arcmin2 nBX=2.0x10⁻³ Mpc-3 BM: z=1.5-2.0 (118) SBM=3.8/arcmin2 nBM=1.7x10⁻³Mpc-3 750 gals at z=1.4-2.5 (Steidel et al. 2004; Adelberger et al. 2004) Unsmoothed BX/BM/LBG with R<=25.5
Other surveys & space densities: • K20 (z=1.4-2.5): ~10-4/Mpc3 • GDDS (z=1.6-2.0):~10-4/Mpc3 • SMG (z~2.5): ~10-5 /Mpc3 • FIRES(z=2-3.5):~10-4/Mpc3 Redshift Distributions LBG: z~3 (940) SLBG=1.7/arcmin2 nLBG=1.4x10⁻³Mpc-3 BX: z=2-2.5 (816) SBX=5.2/arcmin2 nBX=2.0x10⁻³ Mpc-3 BM: z=1.5-2.0 (118) SBM=3.8/arcmin2 nBM=1.7x10⁻³Mpc-3 750 gals at z=1.4-2.5 (Steidel et al. 2004; Adelberger et al. 2004) Unsmoothed BX/BM/LBG with R<=25.5
Other redshift desert surveys • Other surveys with galaxies at z~1.4-2.5 • K20/BzK (Cimatti et al.) (K<20 selection)(~40) • Gemini Deep Deep (Abraham et al.) (K<20.6, photo-z) (34) • Radio-selected SMG (Chapman et al.) (73) (+18 OFRG) • FIRES (Franx, van Dokkum et al.) (J-K selection) (~10) • Now that there are several groups using different selection techniques to find galaxies at z~2, we need to understand how the samples relate to each other • Reddy et al. (2005) considered the overlap among different samples, and contribution of each to the sfr density at z~2-2.5
Evolution of Galaxy Metallicities • Gas phase oxygen abundance in star-forming galaxies • Fundamental metric of galaxy formation process, reflects gas reprocessed by stars, metals returned to the ISM by SNe explosions (HII regions in sf-galaxies, stars in early-type). • Galaxies display universal correlations between Luminosity (L), Stellar mass (M), and metallicity (Z) • Departures from closed-box expectations can reveal evidence for outflow/inflow • Closed box: • Z = y x ln (1/m) • (Z=metallicity, y=yield, m=gas fraction=Mgas/(Mgas+M*))
Evolution of Galaxy Metallicities • 10,000s of galaxies in the local universe with O/H • Now the challenge is to obtain these measurements at high redshift (evolution will give clues, compare metal census with inferred metal density from integrating the global star-formation history) • Measuring gas fractions is very important to quantify how much material has been processed into stars -- currently very indirect • Physical conditions may be different in high-redshift HII regions: implications for inferred metallicities!!!
Abundance Measurements vs. z • Lots of local emission line measurements (10000’s, 2dF, Sloan) • At z=0.5-1, 4 groups (>=200 gals, CFRS, DGSS, CADIS, TKRS) • At z>2 there were < 10 measurements (mainly LBGs) • DLAs provide metallicity information from abs lines, but hard to relate (Tremonti et al. 2004)
Near-IR spectroscopy of z~2 gals • z~2 ideal for measuring several neb lines in JHK • evidence of M-Z relation at z~2, intriguing information about HII region physics
[NII]/Ha ratios: z~2 metallicities • relationship between [NII]/Ha and O/H • N is mixture of primary and secondary origin • age, ionization, N/O effects, integ. spectra, DIG, AGN • (Pettini & Pagel 2004) N2=log([NII] 6584/Ha) 12+log(O/H)=8.9+0.57xN2 s~0.18, factor of 2.5 in O/H
Near-IR spectroscopy of z~2 gals • Ha spectra of 101 z~2 gals KeckII/NIRSPEC • Kinematics: linewidths, Mdyn, some spatially-resolved, tilted lines, compare with stellar masses • Line ratios: HII region metallicities, physical conditions • Ha fluxes: SFRs, compare with UV, models • Offsets between nebular, UV abs and Lya em redshifts -> outflows M*=41011 M K=19.3, J-K=2.3 M*=5109 M
Local M-Z Relationship • M-Z possibly more fundamental than L-Z relationship • closed box model relates gas fraction and metallicity, according to the yield • SDSS sample revealed lower effective yield in lower mass galaxies • importance of feedback (Tremonti et al. 2004)
Local M-Z Relationship • We have metallicity information for a large sample of (~100) galaxies at z~2 • For the majority of these, we have used broadband optical and IR photometry to estimate stellar masses (see next slides) • Therefore we can construct a z~2 M-Z relationship (Tremonti et al. 2004)
Opt/NIR SED: Age/Dust Degeneracy • Only optical photometry can’t distinguish between age/dust • Balmer break is sensitive to A/O stars age • K-band probes other side of Balmer break • More discriminating power, IRAC gives you even more (???) • (Shapley et al. 2001, Papovich et al. 2001)
Stellar Populations & Masses • Near/Mid-IR Imaging • Deep J, K imaging with WIRC, Palomar 5-m, to Ks~22.5, J~23.8 • 4 fields, ~420 galaxies with zsp> 1.4 • Spitzer IRAC data in Q1700 field, 3.6, 4.5, 5.4, 8 m • Combine optical and IR SED to model stellar populations, masses Ks (2.15 mm) (Barmby et al. 2004, Steidel et al. 2005)
Stellar Populations & Masses • Near/Mid-IR Imaging • Deep J, K imaging with WIRC, Palomar 5-m, to Ks~22.5, J~23.8 • 4 fields, ~420 galaxies with zsp> 1.4 • Spitzer IRAC data in Q1700 field, 3.6, 4.5, 5.4, 8 m • Combine optical and IR SED to model stellar populations, masses IRAC (4.5 mm) (Barmby et al. 2004, Steidel et al. 2005)
z~2 M-Z Relationship • New sample of 87 star-forming galaxies at z~2 with both M* and [NII[/Ha (gas phase O/H) measurements • Divide into 6 bins in M* , which increases as you move down • clear increase in [NII]/Ha with increasing M* • M-Z at z~2!! (Erb et al. 2005)
z~2 M-Z Relationship • Evol. Comparison with SDSS, where Z is based on [NII]/Ha (for both samples) • Clear offset in relations --> at fixed stellar mass, z~2 galaxies significantly less metal rich than local gals • Not evolutionary (z~2 probably red&dead by z~0) (Erb et al. 2005)
z~2 M-Z Relationship • Important: measure change of Z with m (gas fraction) • Must estimate Mgas, which we do from SHa, to Ssfr, to Sgas (assuming Schmidt law) • Very indirect! • Low stellar mass objects have much higher m (Erb et al. 2005)
z~2 M-Z Relationship (Erb et al. 2005) • Different models for feedback, using different yields and different outflow rates • Data are best fit by model with super-solar yield and outflow rate greater than SFR (for all masses) • Rate of change of m with metallicity gives evidence for feedback ; m is very important (estimated indirectly)
z~2 M-Z Relationship (Erb et al. 2005) • Increase of Z with decreasing m is shallower than expected for no outflow. Same thing goes for increase of Z with M* • Important: SDSS sample showed evidence for preferential loss of metals from lower mass galaxies (would be steeper) • While the range of baryonic masses in the z~2 sample is small, we see NO evidence for preferential metal loss for less massive galaxies • Remember: outflows generic feature of UV-selected gals, metals in cluster gas
z~2 Physical Conditions • Well-defined sequence in [OIII]/Hb vs. [NII]/Ha in local galaxies (SDSS) (star-formation vs. AGN) • small sample of z~2 star-forming galaxies with [OIII]/Hb are offset from this locus (as is DRG) • ne, ionization parameter, ionizing spectrum (IMF, star-formation history) • Implications for derived O/H (Erb et al. 2005)
z~1 Physical Conditions • Well-defined sequence in [OIII]/Hb vs. [NII]/Ha in local galaxies (SDSS) (star-formation vs. AGN) • z~1.4 star-forming galaxies are offset from this locus (as is DRG) • ne, ionization parameter, ionizing spectrum (IMF, star-formation history) • Implications for derived O/H (Shapley et al. 2005)
z~2 Physical Conditions • Among K<20 galaxies (brightest 10%), [SII] line ratio indicates high electron density • Inferred electron density is ~1000/cm3, • This is higher than in local HII regions used to calibrate N2 vs. O/H relationship • (Pettini et al. 2005)
Beyond [NII]/Ha: All the lines • Deriving Oxygen Abundance from [NII]/Ha relied on several assumptions • Physical conditions appear different. Observations of full set of lines important for constraining sfr in high redshift objects • GNIRS/Gemini O H O H N (van Dokkum et al. 2005)