Download
1 / 51
510 likes | 626 Views
Region 1 Air Resource & Wilderness. Thomas Dzomba – Air Fire & Aviation Mark Story – Gallatin NF. Objectives. Overview of Region 1 Air Program AQRV/WAQV Monitoring & Results Emerging Air Quality Issues. Air Quality Responsibilities. meet state and National AQ standards

E N D
Region 1 Air Resource & Wilderness Thomas Dzomba – Air Fire & Aviation Mark Story – Gallatin NF
Objectives • Overview of Region 1 Air Program • AQRV/WAQV Monitoring & Results • Emerging Air Quality Issues
Air Quality Responsibilities • meet state and National AQ standards • identify, monitor, protect AQRV’s • coordinate air quality and smoke management with Montana & Idaho DEQ’s, local AQ agencies, and EPA • NEPA disclosure of air quality related effects
Region 1 Key Air Quality Issues • Urban & Industrial Emissions • Oil/Gas Development • Regional Haze/Visibility • Prescribed and Wildfire Smoke
Regional Haze/Visibility • Idaho SIP • Montana FIP • IMPROVE Monitoring • Webcams
Coordination • Liaison between FS and regulatory agencies (state/local DEQs/EPA) • Work with WO on Smoke and Air Quality Issues • MT/ID Airshed Group • GYACAP • Modeling and Monitoring
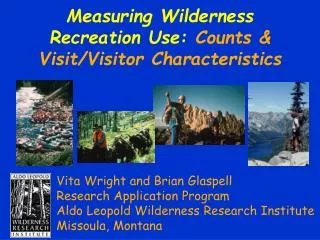
AQRV/WAQV Monitoring • Particulate Matter • Visibility • Lakes • Lichens • Snow • Precipitation
Selway Bitterroot Wilderness Bob Marshall Wilderness Lee Metcalf Wilderness
USFS R1 Wilderness Air Quality Monitoring Plan Mark Story - Gallatin National Forest Thomas Dzomba - USFS R1/R4 Air Fire & Aviation Jill Grenon - Gallatin National Forest & Montana State University February 1, 2008
BMW – Bob Marshall Wilderness ABW – Absaroka Beartooth Wilderness SGW – Scapegoat Wilderness LMW – Lee Metcalf Wilderness CMW – Cabinet Mountains Wilderness GBW – Great Bear Wilderness SBW – Selway Bitterroot Wilderness RW – Rattlesnake Wilderness APW – Anaconda Pintler Wilderness WCW – Welcome Creek Wilderness GMW – Gates of the Mountains Wilderness GHW – Gospel Hump Wilderness MMW – Mission Mountains Wilderness * operated by non-USFS agencies sites monitored by USFS R1
Lichens • Long range air quality monitoring • Collected every 5-7 years by Dr. Larry St. Clair of BYU • Will be collected FY 2007 - 2010
Rocky Mountain SnowpackNetwork • Complements network • of NADP wetfall sites • Collocated with SNOTEL • Stations reporting SWE, • Air temp max, mins Lake Fork Grizzly Ridge Music Pass
Dissolved Ammonium • Highest levels of ammonium generally in Central Subregion—espTarghee Pass Yellowstone, and the Tetons • Lionshead (11.0 ueq/L) • West Yellowstone, offroad (12.1 ueq/L) • Highest NH4 in region from snowpacked roadway at • local-source site (over-snow veh., West Yellowstone, 15.6 ueq/L). • Other Ag areas: North-central Colo. Mts, Sierra Madre, S. Colo. and northern New Mex. Lions’ West
Dissolved Nitrate 15K • Highest levels of nitrate generally in Southern Subregion—esp North-central Mts, Sierra Madre, NW Colo., and northern New Mex. • Also in Uintas, Targhee Pass, and S. Pass at lower end of Wind River Mts • Divide Peak (12.4 ueq/L) • Grizzly Ridge (12.1 ueq/L) 7.6K 4.6K 48K 105 Divide Pk 48K Grizzly 45K 38K 49K 49K
Total Mercury Mt. Belmont • Highest levels of mercury (dissolved + particulate) generally in Southern Subregion—esp near 4 Corners • Other distinct signals appear in Montana from Chief Joe Pass eastward past Helena to Kings Hill, and at Targhee Pass • Slumgullion Pass (31.3 ng/L) • Mt. Belmont (20.3 ng/L) Slumgullion
Cabinet Mountain Wilderness Lower Libby Upper Libby Selway-Bitterroot Wilderness North Kootenai Shasta Absaroka-Beartooth Wilderness Stepping Stone Twin Island
Statistics • SAS Institute statistical software was used to run analyses following draft USFS Data Analysis Protocol (DAP) recommendations in coordination with Lori Porth, RMRS Statistician • Non-parametric test that can work with non-normal distributions and are not affected by errors, gross outliers, or missing data in the data set. • A trend is detectable and considered significant if it meets our designated alpha level of α = 0.1 also shown as 90% confidence level. Additional confidence levels used were 95 (α = 0.05), 99 (α = 0.01), and 99.9 (α = 0.001). (Salmi et.al 2002).
National Atmospheric Deposition Program (NADP) • Chemistry of rain and snow • Lost Trail Pass MT97
NADP sites in and around MT Glacier Clancy Lost Trail Pass Little Bighorn Tower Junction Cratersof the Moon
IMPROVE SITES GLAC1 CABI1 MONT1 GAMO1 SULA1 YELL2
Bitterroot Valley (Stevi RD) Bob Marshall (Seeley Lake RD) Gates of the Mountains (Helena RD)
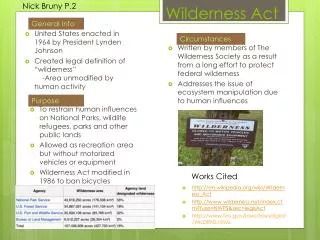
Yell2 IMPROVE site on a clear day and on a hazy day Spectrum Seriesdv=0 Bext=10 SVR=390 Spectrum Seriesdv=17 Bext=52 SVR=75
Conclusions • Trend interpretation, particularly cause/effect, is difficult and complex • Lake ANC decrease not statistically validated except at Stepping Stone Lake. The pH increasing trend and decrease in lake cation trends are not readily explainable • Consistent NH4 increase trend at all of the NADP sites. This may be partially due to increased agriculture emissions such as feedlots in E. Oregon and E. Washington
Conclusions • NO3 trend increases in lakes and NADP not as consistent as NH4 increase • Consistent decrease SO4 at NADP sites is consistent with US trends the last 2 decades with reduced industrial sulfate emissions • Consistent improvement in visibility at all of the IMPROVE sites as expressed in increased SVR, decreased deciviews, and reduced extinction • 20% best and worst seasonal visibility day trends visually correlates well with wildfire emissions in USFS Region 1
Regional Haze – visibility targets Airborn contaminants Climate change PM2.5 standards Ozone standards Critical Loads Emerging Air Quality Issues
Western Airborn Contaminants Project NPS - 2009
Climate Projections for North America Northern Rockies: Roughly 3-4° F average annual warming by 2050 and 6° F by 2100; no change to ~ 5% increase in annual precipitation; Drier summers and slightly wetter winters (DJF); Potential for more dramatic extremes.
Regional Haze – visibility targets Airborn contaminants Climate change PM2.5 standards Ozone standards Critical Loads Emerging Air Quality Issues