Download
1 / 1
10 likes | 169 Views
Name. Abell (3) Radius. Abell 634. 8 h 14 m 33.7 s. Right Asc. (1). Declinat. (1). +58 o 02' 52". 7945. Vel (1). Redshift (1). 0.0265. 391. s v (km/s). 0.006:. L x (bol) (2). III. BM type (1). 66. Star-Forming Galaxies in a Nearby Group: Abell 634.

E N D
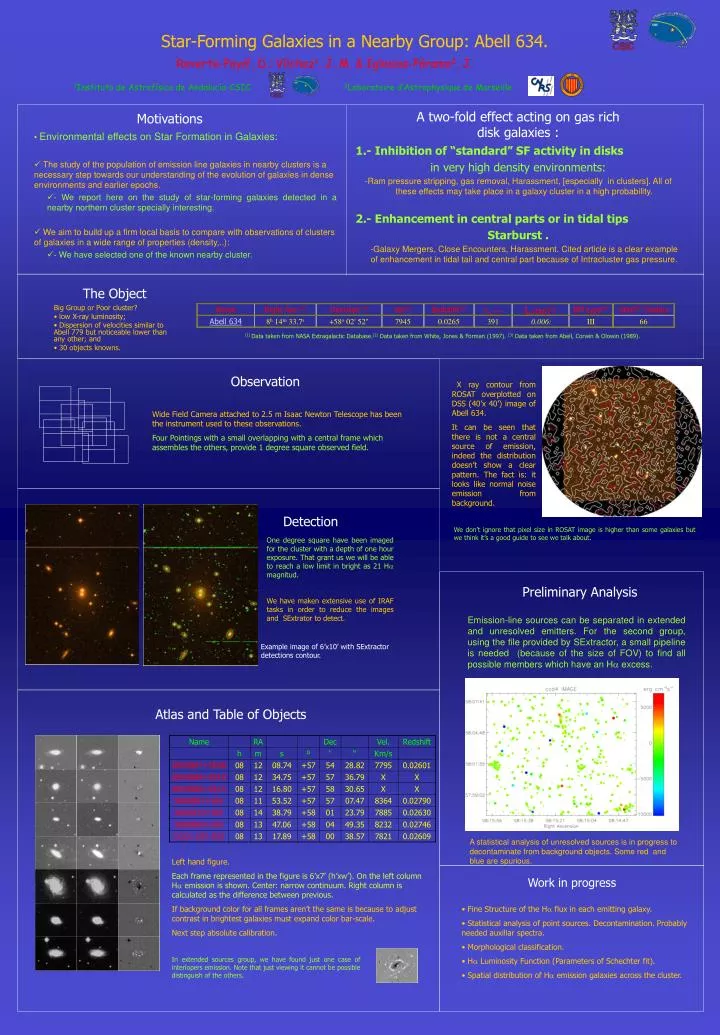
Name Abell(3) Radius Abell 634 8h 14m 33.7s Right Asc.(1) Declinat.(1) +58o 02' 52" 7945 Vel(1) Redshift(1) 0.0265 391 sv (km/s) 0.006: Lx(bol)(2) III BM type(1) 66 Star-Forming Galaxies in a Nearby Group: Abell 634. Reverte-Payá1, D.; Vílchez1, J. M. & Iglesias-Páramo2, J. 1Instituto de Astrofísica de Andalucía-CSIC 2Laboratoire d’Astrophysique de Marseille A two-fold effect acting on gas rich disk galaxies : Motivations • Environmental effects on Star Formation in Galaxies: • The study of the population of emission line galaxies in nearby clusters is a necessary step towards our understanding of the evolution of galaxies in dense environments and earlier epochs. • - We report here on the study of star-forming galaxies detected in a nearby northern cluster specially interesting. • We aim to build up a firm local basis to compare with observations of clusters of galaxies in a wide range of properties (density,..): • - We have selected one of the known nearby cluster. 1.- Inhibition of “standard” SFactivity in disks in very high density environments: -Ram pressure stripping, gas removal, Harassment, [especially in clusters]. All of these effects may take place in a galaxy cluster in a high probability. 2.- Enhancement in central parts or in tidal tips Starburst . -Galaxy Mergers, Close Encounters, Harassment. Cited article is a clear example of enhancement in tidal tail and central part because of Intracluster gas pressure. The Object • Big Group or Poor cluster? • low X-ray luminosity; • Dispersion of velocities similar to Abell 779 but noticeable lower than any other; and • 30 objects knowns. (1) Data taken from NASA Extragalactic Database.(2) Data taken from White, Jones & Forman (1997). (3) Data taken from Abell, Corwin & Olowin (1989). Observation X ray contour from ROSAT overplotted on DSS (40’x 40’) image of Abell 634. It can be seen that there is not a central source of emission, indeed the distribution doesn’t show a clear pattern. The fact is: it looks like normal noise emission from background. Wide Field Camera attached to 2.5 m Isaac Newton Telescope has been the instrument used to these observations. Four Pointings with a small overlapping with a central frame which assembles the others, provide 1 degree square observed field. Detection We don’t ignore that pixel size in ROSAT image is higher than some galaxies but we think it’s a good guide to see we talk about. One degree square have been imaged for the cluster with a depth of one hour exposure. That grant us we will be able to reach a low limit in bright as 21 H magnitud. We have maken extensive use of IRAF tasks in order to reduce the images and SExtrator to detect. Preliminary Analysis Emission-line sources can be separated in extended and unresolved emitters. For the second group, using the file provided by SExtractor, a small pipeline is needed (because of the size of FOV) to find all possible members which have an H excess. Example image of 6’x10’ with SExtractor detections contour. Atlas and Table of Objects A statistical analysis of unresolved sources is in progress to decontaminate from background objects. Some red and blue are spurious. Left hand figure. Each frame represented in the figure is 6’x7’ (h’xw’). On the left column H emission is shown. Center: narrow continuum. Right column is calculated as the difference between previous. If background color for all frames aren’t the same is because to adjust contrast in brightest galaxies must expand color bar-scale. Next step absolute calibration. Work in progress • Fine Structure of the H flux in each emitting galaxy. • Statistical analysis of point sources. Decontamination. Probably needed auxiliar spectra. • Morphological classification. • H Luminosity Function (Parameters of Schechter fit). • Spatial distribution of H emission galaxies across the cluster. In extended sources group, we have found just one case of interlopers emission. Note that just viewing it cannot be possible distinguish of the others.