Download
1 / 41
410 likes | 562 Views
Characterization of Glycan Structure Essentials in Glycobiology June 1, 2004 Brad Hayes. Roles of Glycoprotein-associated Carbohydrates. Quality Control/folding. (deglucosylation/reglucosylation) Solubility. Circulating half-life. (LH, FSH, vWF, ASGPR) Cell-cell interactions.

E N D
Characterization of Glycan Structure Essentials in Glycobiology June 1, 2004 Brad Hayes
Roles of Glycoprotein-associated Carbohydrates • Quality Control/folding. (deglucosylation/reglucosylation) • Solubility. • Circulating half-life. (LH, FSH, vWF, ASGPR) • Cell-cell interactions. (lymphocyte homing)
Pharmaceutical Concerns Regarding Carbohydrates • Pharmacokinetics: Influence on receptor binding. • Pharmacodynamics: Distribution. Clearance. • Define product as “well-characterized”. • Lot-to-lot variability. • Definition of intellectual property.
Carbohydrate Analysis Offers Unique Challenges • Branched. • Synthesis is not “template driven”. • Alternative linkage positions are possible. • Alternative anomeric configurations are possible. • Cell-type specific glycosylation. • Influence of environmental conditions. [Glucose] [NH3] pH • Site-specific glycosylation. • Microheterogeneity.
Considerations in Designing an Analytical Scheme Question Amount of Material Resources
Workflow Purity Release of Glycans Enzyme Digestion Salts Sample Prep Separation HPLC CE PAD Fluorescence MS Detection
Analysis of Glycans Still Bound to Proteins Is the protein of interest glycosylated? Fluorescent detection of sialic acids (<1pMole). Monosaccharide composition analysis. If so, are there N-glycans or O-glycans or both? Mannose vs. Galactosamine (GalNAc) What is the contribution to molecular weight? Monosaccharide composition on a per mg basis. Compare monosaccharide to amino acid composition.
Sialic Acid Determination Diverse family of molecules. Humans make antibodies against animal proteins withNeuGc. Sialylation depends on culture conditions. Incomplete sialylation associated with increased clearance. When sample limited: Is my protein glycosylated? Is there enough material for monosaccharide analysis? When sample not limited: Batch-to-batch variability for recombinant proteins. Extent of deglycosylation for crystallogrphic analysis. Assess diversity of sialic acids present.
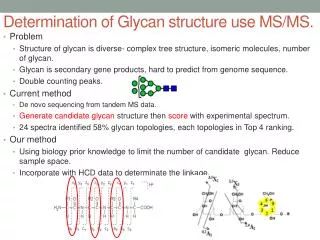
Sialic Acid Determination Release with mild acid (2 m HOAc, 80oC, 3 hrs.). “specific” for sialic acid release doesn’t remove modifications from NeuAc Anaylze by HPAEC-PAD sensitivity of ~200 pMoles Analyze by RP- HPLC after fluorescent derivatization. OPD DMB (~ 1 pMole) Analyze by GC-MS as heptafluorobutyrate derivative.
Morimoto et.al. Anal. Chem. 2001 Neu5,9Ac2 BSM Sialics Neu5Ac Neu5Gc Neu5,7Ac2 Neu5Gc9Ac Fluorescence Neu5,7(8),9Ac3 Reagent 0 5 10 15 20 25 30 35 40 45 Time (minutes) Sensitive Sialic Acid Determination
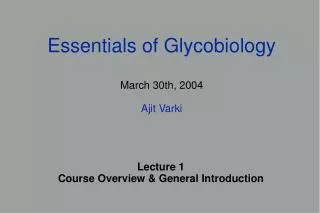
Standards 50 Fuc GalNH2 Glc GlcNH2 40 Gal Man/Xyl nC 30 20 0 5 10 15 20 25 Time (minutes) Composition Analysis: Neutral and Amino Sugars Is my protein glycosylated? Are there N- or O-glycans? Relative contribution to mass? What are the likely structures? Hydrolysis, dry, HPAEC-PAD
Predicted Structures Data Major Species Minor Species a3 b6 b3 a6 b3 a6 nMoles Monosaccharide 0 Fucose Galactosamine 0.366 0.03 Glucosamine Galactose 0.317 0.672 Glucose Mannose/Xylose 0.115 NeuAc 0.558 Analysis of a Human Protein No N-Glycans. On average, only one O-glycan per protein molecule. No NeuGc, as expected.
Composition Analysis: Neutral and Amino Sugars GC-MS of TMS derivatives: or alditol acetates or heptafluorobutyrate www.ccrc.uga.edu/~rcarlson/Carbstr.pdf CE analysis of APTS derivatized monosaccharides From Beckman-Coulter Primer 8 on CE Chen and Evangelista Anal. Chem. 1995
Release of Glycans for Further Analysis Release of N-glycans: PNGase F. Broad spectrum for release of N-glycans blocked by core a1,3 Fuc or bisecting Xyl PNGase A. core a1,3 Fuc or bisecting Xyl okay Prefers smaller, neutral glycans Endo H. Only if ManII has not yet acted Hydrazine Release of O-glycans: Alkaline induced b-elimination. Can’t fluorescently tag O-glycanase. Only Galb1,3GalNAc Hydrazine Release of glycolipid glycans: Endoglycoceramidase
Glycan Profiling Charge Size Heterogeneity Comparative differences between samples Need to consider separation with detection
29.35 28.85 20 nC 10 0 40 30 20 Time (minutes) N eu5 A c 3 G al 4 G lc NA c 2Ma n 6 a b b a Ma n 4 G lc NA c 4 G lc NA c (- o l) b b N eu5 A c 6 G al 4 G lc NA c 2Ma n 3 a b b a N eu5 A c 3 G al 4 G lc NA c 4 a b b N eu5 A c 6 G al 4 G lc NA c 2Ma n 6 a b b a Ma n 4 G lc NA c 4 G lc NA c (- o l) b b N eu5 A c 6 G al 4 G lc NA c 2Ma n 3 a b b a N eu5 A c 3 G al 4 G lc NA c 4 a b b Profiling Glycans by HPAEC-PAD Advantages: Fast. Few pMole sensitivity. Reproducible. Disadvantages: Retention time only. Introduces salt. Sialic acid modifications. NeuAc(a2,3)Gal elute later than NeuAc(a2,6)Gal Gal(b1,3)GlcNAc elute later than Gal (b1,4)GlcNAc Fucosylated elute earlier than non-fucosylated Neu5Gc elute later than Neu5Ac +/- Exoglycosidases
Fluorescent Derivatization Anumula, K. Anal. Biochem. 2000
Profiling/Sequencing Tagged Glycans by NP-HPLC Anumula and Dhume Glycobiology 1998 Guile et.al Anal. Biochem. 1996
+Hexosaminidase +Hexosaminidase + 1-2,3 mannosidase Profiling/Sequencing Glycans by CE-LIF Ma and Nashebeh Anal. Chem. 1990
Profiling Glycans by MALDI-TOF Mass Spectrometry Native glycans Charge heterogeneity Loss of sialic acid matrix acidity Post-source decay Fragmentation mainly at the glycosidic bonds Preferential cleavages limit structural information Permethylated glycans “Neutralize” carboxyl groups Reduced desialylation Enhanced cross-ring cleavages
Flight tube High voltage Pulsed laser • Simplified Schematic of a MALDI-TOF With MALDI ionization get almost exclusively singly charged species
Normal or 10,000 4414.83 2793.05 A B U N D A N C E 4589.03 2431.68 5,000 3242.52 4053.39 3603.90 3692.02 4660.12 5324.88 3487.79 4228.86 4834.30 5572.17 5151.69 Patient 8,000 MASS (m/z) 2431.87 4,000 2793.05 4053.72 3692.49 3243.29 3866.59 4227.81 5324.38 4414.83 3603.48 3937.64 5151.25 5571.77 2000 2800 3600 4400 5200 6000 MALDI-TOF Profiling of Glycans in Disease
Sequencing of Glycans with Mass Spectrometry Already touched on use of exoglycosidases with separation either by HPLC or CE and detection either by PAD or fluorescence Can also use mass spectrometry for sequencing. Mechref et.al. Carbo Res. 1998
Branching and Linkage Analysis How the components are put together
Sequencing of Glycans with Mass Spectrometry Mechref et.al. Carbo Res. 1998
Ionization Method Collision Cell Mass Analyzer/ Selector MALDI ESI Quadrapole Ion Trap Detector Quadrapole Ion Trap TOF Linkage Analysis with Mass Spectrometry
Linkage Analysis with Mass Spectrometry Sheeley and Reinhold Anal. Chem. 1998
Methylate exposed hydroxyl groups. Hydrolyze glycosidic bonds. Reduce with borohydride. Acetylate newly created hydroxyl groups. Analyze by GC-MS. Linkage analysis by GC-MS of partially methylated alditol acetates.
ST6Gal-I wt Abundance 3Gal1 6Gal1 Gal1- 14 16 18 20 22 24 time (minutes) ST6Gal-I null 2,4Man1 Abundance 2Man1 2,6Man1 3,6Man1 Fuc1- 14 16 18 20 22 24 time (minutes) Linkage Analysis of Total N-Glycans from ST6Gal-I Deificient Mice by GC-MS
Sia3 H3eq Sia3 H3ax Sia6 H3eq Sia6 H3ax (–) (+) Linkage Analysis by NMR Spectroscopy 500 MHz nano-NMR spectra from total N-glycans from ST6Gal-I deficient mice .
400 N-Glycans from ST6Gal-I deficient mouse liver 2 16 17 300 1 14 12 200 44 nC 45 5 31 100 4 10 20 46 43 9 0 0 10 20 30 40 50 60 7000 Time (minutes) 2853.10 Peak 44 A B U N D A N C E 0 2000 2600 3200 3800 4400 5000 MASS (m/z) 6000 2853.10 Peak 45 2000 2600 3200 3800 4400 5000 MASS (m/z) MALDI-TOF Analysis of HPAEC Fractions
Analysis of Glycosaminoglycans Isolate GAG/proteoglycan by ion exchange chromatography. Depolymerize enzymatically to generate disaccharides. Fraction disaccharides (IP-RP HPLC, IEC HPLC). Detect by UV (>100 pMoles). Detect fluorescently following post-column derivatization (<10 pMoles).
Post-column Labeleing with 2-Cyanoacetamide • 2-Cyanoactamide reacts with reducing sugars under basic conditions at high temperature. • Used as post-column derivatization for GAG disaccharide analysis. • Applicable to any separation.
Flow Path for Post-column Labeling >100 pMole UV Detector Column IP-RP HPLC IEC HPLC 1% 2-CA 0.25 M NaOH “Cooling Bath” Fluorescence Detector Reaction Coil 130oC >5 pMole
Ion-Pair Rerverse Phase HPLC Analysis of Serum Chondroitin Sulfate Control 800 Di-4S 600 400 200 Di-0S Fluorescence Patient 200 Di-4S Di-6S Di-0S Di-diSE 100 0 Stds Di-0S Di-diSB Di-UA2S 300 Di-6S Di-diSD Di-4S Di-diSE Di-TriS 100 Time (minutes) 0 0 10 20 30 40 50 60 70 Results from ~10 ml of serum
50 pMole of Heparin Disaccharides Stds UA-[1,4]-GlcNAc UA-[1,4]-GlcNAc-6S UA-[1,4]-GlcNS 200 UA-2S-[1,4]-GlcN UA-2S-[1,4]-GlcN-6S UA-[1,4]-GlcN-6S UA-2S-[1,4]-GlcNS-6S UA-[1,4]-GlcNS-6S UA-[1,4]-GlcN 100 UA-2S-[1,4]-GlcNS 0 Fluorescence Lyase Digest of 1 ug Authentic Heparin UA-2S-[1,4]-GlcNS-6S 1000 UA-[1,4]-GlcNAc-6S UA-[1,4]-GlcNS UA-2S-[1,4]-GlcNAc-6S UA-[1,4]-GlcNS-6S UA-2S-[1,4]-GlcNS UA-[1,4]-GlcNAc 0 0 10 20 30 40 50 60 70 Time (minutes) Ion Exchange Fractionation of Heparin-derived Disaccharides UA-2S-[1,4]-GlcNAc-6S
1,4 Galactosyl- transferase Protein-O-GlcNAc Protein-O-GlcNAc-[3H]Gal UDP UDP-[3H]Gal NaOH [3H]Galb1,4GlcNAcitol Protein-O-GlcNAc-[3H]Gal NaBH4 Test for O-GlcNAc O-GlcNAc is a substrate for galactosyltransferase and can be radiolabeled using UDP-[3H]galactose as the donor. O-GlcNAc is susceptible to alkaline-induced b-elimination.
Gal1,3GalNAcitol Gal1,3GlcNAcitol Gal1,4GlcNAcitol Pit 1 is O-GlcNAcylated Separation of disaccharide alditols on Dionex MA-1 column
Summary There are many options available for characterizing glycans. The choice of approaches and technologies depends on the question asked and the depth of understanding required. A complete structural characterization generally requires the use of several different and complementray techniques.