Download
1 / 37
370 likes | 474 Views
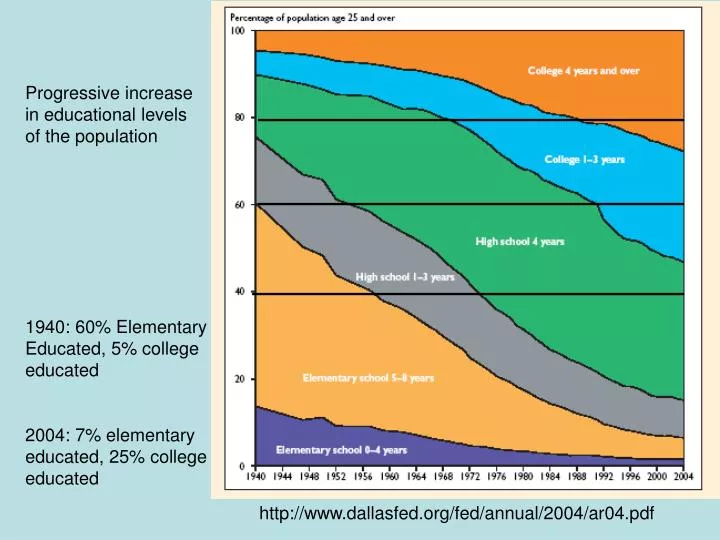
Progressive increase in educational levels of the population. 1940: 60% Elementary Educated, 5% college educated 2004: 7% elementary educated, 25% college educated. http://www.dallasfed.org/fed/annual/2004/ar04.pdf. Money Earnings (Mean) for Full-Time, Year-Round Male Workers, 2003.

E N D
Progressive increase in educational levels of the population 1940: 60% Elementary Educated, 5% college educated 2004: 7% elementary educated, 25% college educated http://www.dallasfed.org/fed/annual/2004/ar04.pdf
Money Earnings (Mean) for Full-Time, Year-Round Male Workers, 2003 Lifetime Sum of College vs High School Earnings $593,000
Money Earnings (Mean) for Full-Time, Year-Round Female Workers, 2003 Lifetime Sum of College vs High School Earnings $415,000
College Enrollment and College Wage Premium Based on Ehrenberg and Smith. 2006: Table 9.1, p. 286
College Enrollment and College Wage Premium 6 point increase in wage premium raise male enrollment by 1 point 3 point increase in wage premium raise female enrollment by 1 point Based on Ehrenberg and Smith. 2006: Table 9.1, p. 286
Male Profile Female Profile
Stylized Facts Regarding Age Earnings Profiles • All profiles flatten with age Most rapid wage growth early in career • Earnings increase with education • Earnings gap between education groups widens with age • Male female comparisons • Female earnings lower than male earnings • Female wage profiles flatter than men Note: These are synthetic cohorts—longitudinal data may differ especially for women
Factors affecting returns to college in the Human Capital Model Ht = Earnings from High School Education in year t St = Earnings from College Education in year t Ct = College Tuition in year t r = Rate of time preference T = Time Span
Factors affecting returns to college in the Human Capital Model PVS = Present Value of College Salary PVS = PVC = Present Value of College Costs
Factors affecting returns to college in the Human Capital Model Ht => decreases incentive to invest St => increases incentive to invest Ct => decreases incentive to invest r => decreases incentive to invest T => increases incentive to invest NPV = NPV: Net Present Value
Factors affecting returns to college in the Human Capital Model Internal rate of return: the interest rate that sets NPV = 0 Measure of the returns to college NPV =
How does human capital investment model explain the pattern of age earnings profiles? • All profiles flatten with age Most rapid wage growth early in career Role of T in human capital investment As age increases, incentive to invest falls
How does human capital investment model explain the pattern of age earnings profiles? • Earnings increase with education S>H required for investment
How does human capital investment model explain the pattern of age earnings profiles? • Earnings gap between education groups widens with age More educated get more firm-provided training Sorting on r: More educated have lower r?
How does human capital investment model explain the pattern of age earnings profiles? 4) Male female comparisons • Female earnings lower than male earnings Discrimination? Role of discontinuous labor supply Human capital decay affects occupational choice Absence decreases wages
Source: Anne Preston (2004) Leaving Science: Occupational Exit from Scientific Careers
Source: Anne Preston (2004) Leaving Science: Occupational Exit from Scientific Careers
How does human capital investment model explain the pattern of age earnings profiles? • Male female comparisons 2) Female wage profiles flatter than men Role of marital status in age earnings profiles
How does human capital investment model explain the pattern of age earnings profiles? • Male female comparisons • Female wage profiles flatter than men How have these changed over time
Occupational/Educational Choices getting more similar between men and women
How high do returns have to be for college to break even? NPV = = 0 at breakeven C = $15,000/year H = 20,000/year for 44 years r = 0.10 PV College cost = $110,950 Breakeven S – H = $11,346 over 40 years Total: $453,830 C = $5,000/year H = 20,000/year for 44 years r = 0.10 PV College cost = $79,250 Breakeven S – H = $8,104 over 40 years Total: $324,000
Diminishing returns to schooling Why? Opportunity cost Direct cost Marginal Product of time invested in schooling
Computing returns to schooling Log Earnings Function ln(W) = β0 + β1 ED + β2 EXP + β3 EXP^2 + γZ + ε β1 is a measure of the percentage returns to an additional year of schooling
Alternative estimates of the returns to schooling as summarized in David Card, Handbook of Labor Economics Vol. 3A . 1999 Card, 1995 0.084 Card, 1999 Men 0.106 Women 0.110 Conneely and Uusitalo, 1997 0.114 Ashenfelter and Zimmerman, 1997 0.08 – 0.109
If individuals get returns to schooling, why should the public subsidize it?
If individuals get returns to schooling, why should the public subsidize it? Externalities: Benefits go to individuals other than the one receiving schooling =>Individuals will underinvest relative to social optimum Liquidity constraints: individuals cannot borrow against future expected returns =>Poor will underinvest
Iowa State University Revenue by Source, FY2005 http://www.public.iastate.edu/~inst_res_info/FB06files/finfac06.html
Iowa State University Revenue by Source, FY2001 and FY2005 (Thousands of dollars) Revenues rose by 13.7% compared to 12.3% for inflation • 1 Iowa State Center, Residence System, University Bookstore, Athletic Department. • Ames Laboratory. • Sales of educational activities and equipment, investment income
Higher Proportion Educated means higher per capita income, faster growth Correlation or causation?
Male and Female Enrollment Rates, Ages 15-17, 70 Developing countries >0: Urban Male ed > Female ed 45o line: male = female II I Higher enrollment Quad 1: Males Quad 2: Urban male, Rural Females Quad 3: Females Quad 4: Rural Males, Urban Females >0: Rural Male ed > Female ed III IV
If individuals get returns to schooling, why should the public subsidize it? Are externalities bigger for women? Fertility Health