Download
1 / 23
230 likes | 358 Views
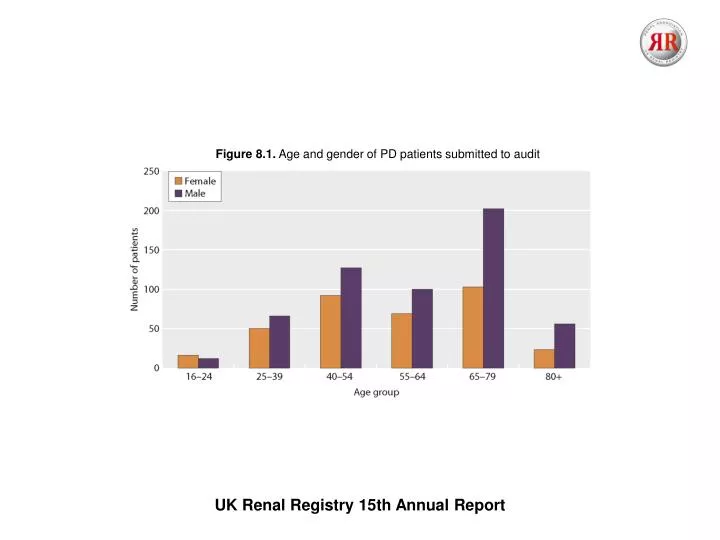
Figure 8.1. Age and gender of PD patients submitted to audit. UK Renal Registry 15th Annual Report. Figure 8.2. Median age of PD patients at first dialysis by renal centre. UK Renal Registry 15th Annual Report. Figure 8.3. Contributory proportions of primary

E N D
Figure 8.1. Age and gender of PD patients submitted to audit UK Renal Registry 15th Annual Report
Figure 8.2. Median age of PD patients at first dialysis by renal centre UK Renal Registry 15th Annual Report
Figure 8.3. Contributory proportions of primary renal disease in UK PD patients UK Renal Registry 15th Annual Report
Figure 8.4. Percentage of patients with each PRD, by deprivation quintile Based on 803 PD patients with a valid postcode in England (128, 149, 156, 175, 195 patients in the 1–5 quintiles) UK Renal Registry 15th Annual Report
Figure 8.5. Deprivation quintile profile for PD patients resident in England Based on 803 PD patients (excludes 113 without valid English postcode) UK Renal Registry 15th Annual Report
Figure 8.6. Number and percentage of dialysis patients on PD, by deprivation quintile Based on 3,508 dialysis patients with valid postcode in England (591 excluded). The bars for HD and PD represent numbers of patients and relate to the left hand axis. The line graph relates to the right hand axis. UK Renal Registry 15th Annual Report
Figure 8.7. Percentage of dialysis patients on PD by quintile and length of time between first seeing a renal physician and starting dialysis UK Renal Registry 15th Annual Report
Figure 8.8. Referral time from first seeing a renal physician to first dialysis for patients starting on PD, by renal network Based on 867 patients who had PD catheter as first access (number of patients in each network listed on y-axis, includes patients with missing data (number in brackets)). Cheshire & Merseyside excluded because none of their 9 patients had referral time data returned. UK Renal Registry 15th Annual Report
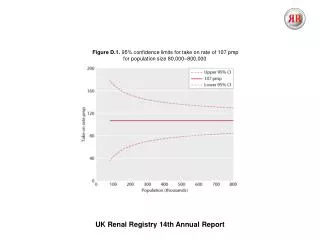
Figure 8.9. Funnel plot relating number of patients per centre and the percentage of PD patients with referral <90 days UK Renal Registry 15th Annual Report
Figure 8.10. Percentage of PD patients in each referral time category by centre Based on 867 patients who had PD catheter as first access (number of patients at each centre listed on y-axis), includes patients with missing data (number in brackets) UK Renal Registry 15th Annual Report
Figure 8.11. Access at first dialysis for centres reporting PD patients, by renal centre Based on 3,867 dialysis patients from centres that reported PD patients. Number of patients at each centre in brackets. UK Renal Registry 15th Annual Report
Figure 8.12. Referral time from first being seen by renal physician to starting dialysis by type of first access Based on 3,545 patients from centres that reported PD patients, who had data on both referral time and type of first access. Total number of patients contributing data to the chart by access type included in x-axis labels (number with missing data in brackets). UK Renal Registry 15th Annual Report
Figure 8.13. Access at 3 months after starting peritoneal dialysis, by referral time Based on 867 patients who had PD as their first access UK Renal Registry 15th Annual Report
Figure 8.14. Type of first access for late presenting patients (referral time of <90 days) by centre Based on 750 patients who had less than 90 days between when they were first seen by a physician and starting dialysis (individual centre totals in brackets). 4 centres do not appear on the chart. Aintree and Stoke returned no data for referral time. Salford and Glan Clwyd had no patients who had a referral time of less than 90 days. UK Renal Registry 15th Annual Report
Figure 8.15. Assessed by surgeon, by renal network for patients with first access as PD catheter Based on 640 patients who had PD as their first modality. Total number of patients listed after centre name (number of patients with missing data in brackets). The following centres are not displayed as they did not return any data: York, Nottingham, Middlesbrough, Leeds, Kent & Canterbury, Hull, Manchester, Gloucester, Derby, Bristol and Liverpool Aintree. A total of 227 patients were excluded from these centres. UK Renal Registry 15th Annual Report
Figure 8.16. Assessed by surgeon, by referral period for patients with PD as first access UK Renal Registry 15th Annual Report
Figure 8.17. PD catheter insertion technique by surgical assessment UK Renal Registry 15th Annual Report
Figure 8.18. PD catheter insertion technique by referral time Based on 732 patients who had PD catheter as their first access and a valid referral time. Six centres were excluded, two due to returning no data about referral time and four due to returning no data about insertion technique. UK Renal Registry 15th Annual Report
Figure 8.19. Catheter failure reason by insertion technique Based on 121 patients. Number of failures by insertion technique in brackets. Inadequate flow covers inflow and outflow. UK Renal Registry 15th Annual Report
Figure 8.20. Reason for catheter failure, diabetic vs. non-diabetic Seven centres (206 patients) excluded due to poor data completeness (<50% of patient records returned with data on diabetes status at time of catheter insertion). No catheter failure recorded for 580 patients. No failure reason recorded for 16 patients who had a failure date recorded. Two patients with no data returned about diabetes status have a failure reason recorded as inadequate flow–inflow and outflow UK Renal Registry 15th Annual Report
Figure 8.21. Percentage of patients who experienced a peritonitis episode within 2 weeks of catheter insertion Ten centres had all their patients (270) excluded due to poor data completeness (<50% completeness for either the diabetes or peritonitis fields). 13 additional patients excluded from chart as no data returned regarding peritonitis. UK Renal Registry 15th Annual Report
Figure 8.22. Number of patients who experienced a peritonitis episode within 2 weeks of catheter insertion, by catheter insertion technique 180 patients excluded due to poor data completeness at their centre (<50% with peritonitis field completed UK Renal Registry 15th Annual Report
Figure 8.23. Catheter survival by insertion technique UK Renal Registry 15th Annual Report