Download
1 / 45
450 likes | 600 Views
Spatial and Temporal Variation in Snow-Water Equivalent. Using NOAA’s Historical Airborne Gamma Data to Assess Snow Trends from 1980 – 2008. Patrick Didier, LT/NOAA Advisor: Thorsten Wagener. Overview.

E N D
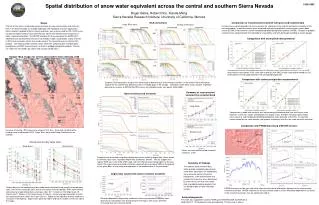
Spatial and Temporal Variation in Snow-Water Equivalent Using NOAA’s Historical Airborne Gamma Data to Assess Snow Trends from 1980 – 2008 Patrick Didier, LT/NOAA Advisor: Thorsten Wagener
Overview • Using NOAA’s airborne snow survey dataset to detect climate patterns for snow-water equivalent (SWE) • 30 years of data representing several different climates within United States • Using modern tools (ArcMap, Spatial Analyst, GeoDa) with archived data • Big question: Has there been a significant change in spatial autocorrelation within the last thirty years? • Final Product: Research Paper
Introduction Figure 1 – Percentage of average annual snowfall divided by annual runoff. (Barnett 2005)
Temperature plays a key role in snowmelt dominated regions (Stewart et al 2005) How is snow measured? SNOTEL (western US) Airborne snow surveys Ground surveys Coop weather stations Satellite imagery Forecasting Techniques Energy budget vs temp index (Day 2009) Research done for specific watersheds Wilamette(Chang et al 2010) Current State of Research
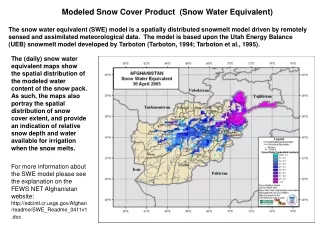
Measures snow water equivalent (water content of the snow pack) • Attenuation of natural, terrestrial radiation by snow is basis of measurement History of NOAA’s Airborne Snow Survey Program • Established in 1978, by Dr Tom Carroll
Natural Terrestrial Gamma Radiation Atmospheric Radon Cosmic Radiation no snow Potassium, Uranium, and Thallium
RadiationSpectra background (no snow) spectrum 40 K Counts/min background spectrum is one-time measurement 208 Tl over snow spectrum 1 2 3 Energy (MeV) Natural Terrestrial Gamma Radiation
10 mi long by 1,000 ft wide (2 mi2 area) Typical Flight Lines
Methods • Assimilate 30 years of flight line data into one standard database (Excel spreadsheet) • Choose flightlines most commonly flown for longest period of time in order to assess both spatial and temporal trends • Evaluate data against ground station and ground survey data • Run flight line data for each survey period in GeoDa to determine spatial relationships • Map out spatial autocorrelation over time for survey regions.
Flight Line Data Over 20,000 records for flight lines since program began in 1980 Some lines only flown once since they were drawn Some lines flown as many as 51 times Database includes flight line, date flown, snow-water equivalent, and lat/lon
Selected Lines • These 260 lines are all 20 years or older, and have each been flown at least twenty times total • They represent “canned” surveys that are flown nearly every year • These surveys are the Colorado Basin, Lake Superior, Northeastern US, St John’s River Basin, and the Red River of the North Surveys • The Cottonwood River in SW Minnesota is flown every year as a calibration survey, but the data are still valid for this project
Data Sources • http://www.weather.gov/geodata/catalog/national/html/province.htm (Canadian Provinces) • US Census TigerLine Data • NCDC for archive historical weather data • NRCS for SNOTEL data in Western US • NOHRSC
Timeline May 30 – complete literature review June 30 – acquire all ground station data July 6 – complete basic outline of article August 30 – complete analysis of data September 30 – complete map, begin filling out sections of article with results October – continue working on article, peer review Presentation possibilities? (eastern snow conference has student paper competition)
Key Literature/Resources • Adam, J.C., Hamlet, A.F., Lettenmaier, D.P. 2009. Implications of global climate change for snowmelt hydrology in the twenty-first century. Hydrological Processes 23, 962-972. • Barnett ,T.P., Adam J.C., Lettenmaier, D.P. 2005. Potential impacts of a warming climate on water availability in snow-dominated regions. Nature 438, 303-309. • Chang H., Il-Won, J. 2010. Spatial and temporal variation changes in runoff caused by climate change in a complex and large river basin in Oregon. Journal of Hydrology 388, 106-207. • Fortin, R., Sander, L., Nadeau, M., Grasty R.L. 2008. An airborne gamma-ray snow survey in the James Bay Region. Proceedings of the 65th Eastern Snow Conference, Fairlee, Vermont USA 2008. http://www.easternsnow.org/proceedings/2009/fortin_et_al.pdf . Accessed 20 June 2011. • Mote P., Hamlet, A., Salathe, E. 2008. Has Spring snowpack declined in the Washington Cascades? Hydrol. Earth Syst. Sci. 12, 193-206. • Stewart, I.T., Cayan, R.D., Dettinger, M.D. 2005. Changes toward earlier streamflow timing across western North America. Journal of Climate 18, 1136-1155. • Eastern/Western Snow Conference Proceedings
Summary • Using unique dataset to look at spatial relationships of SWE over last 30 years. • What possible factors affect the degree of spatial autocorrelation for a given area? • How has that changed (or not changed) over the last 30 years?