Download
1 / 14
150 likes | 435 Views
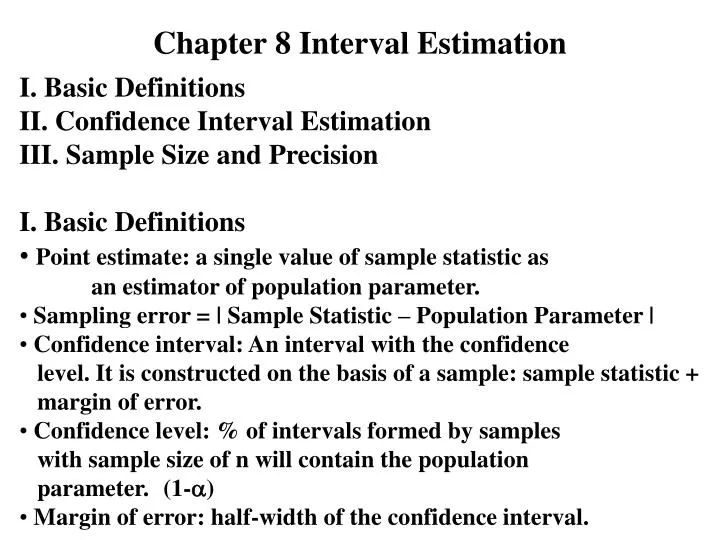
I. Basic Definitions II. Confidence Interval Estimation III. Sample Size and Precision I. Basic Definitions Point estimate: a single value of sample statistic as an estimator of population parameter. Sampling error = | Sample Statistic – Population Parameter |

E N D
I. Basic Definitions • II. Confidence Interval Estimation • III. Sample Size and Precision • I. Basic Definitions • Point estimate: a single value of sample statistic as an estimator of population parameter. • Sampling error = | Sample Statistic – Population Parameter | • Confidence interval: An interval with the confidence level. It is constructed on the basis of a sample: sample statistic + margin of error. • Confidence level: % of intervals formed by samples with sample size of n will contain the population parameter. (1-) • Margin of error: half-width of the confidence interval. Chapter 8 Interval Estimation
II. Confidence Interval Estimation Outline: Procedure: 1. Sample point estimator ( or ) 2. Confidence level and Table Z or tn-1 3. Formulas compute UCL and LCL: point estimator margin of error
[--------------------- ---------------------] [--------------------- ---------------------] Confidence Interval Estimation of Population Mean (σ Known) 1-α=.99 z=2.575 1-α=.95 z=1.96 1-α=.90 z=1.645 1-α UCL LCL [--------------------- ---------------------]
1. Interval Estimation for Population Mean Example 1: p.315 #5 ( known case) In an effort to estimate the mean amount spent per customer for dinner at a major Atlanta restaurant. Data were collected for a sample of 49 customers over a three-week period. Assume a population standard deviation of $5. a. At the 95% confidence, what is the margin error? b. If the sample mean is $24.80, What is the 95% confidence interval for the population mean? HWK: p.315 #8
Example 1: p.315 #5 • Answer: • n = 49 • =$5 • Z: (1-)/2 = 0.95/2 = 0.475 Table 1: Z = 1.96 • 1. • 2. • : [23.4, 26.2]
Example 2: p.324 #16 ( unknown case) • The mean flying time for pilots at Continental Airlines is 49 hours per month. This mean was based on a sample of 100 pilots and the sample standard deviation was 8.5 hours. • At 95% confidence, what is the margin of error? • What is the 95% confidence interval estimate of the population mean flying time? • The mean flying time for pilots at United Airlines is 36 hours per month. Discuss difference between the flying times at two airlines. • HWK: p.324 #16
Example 2: p.324 #16 • Given: n = 100, = 49, S = 8.5, 1- = .95 • Think: What to estimate? Use Z or t? • Answer: • Sample info (given): n = 100, = 49, S = 8.5 • t: 1- =0.95, so /2=0.025, d.f.=n-1=99 • Table 2: d.f.=100, /2=0.025 t=1.984 • d.f.=80, /2=0.025 t=1.990 • *Interpolation: • a. m.o.e.: • b. UCL = 49+1.69 =50.69 LCL = 49 – 1.69 = 47.31 • : [47.31, 50.69] • c. 36 < LCL. The mean flying time is lower at United.
Aside: • Why t? • t distribution: • flatter than Z - more spread out • n , t Z • Degree of freedom: a measure of precision. • The d.f. more precise.
2. Interval Estimation for Population Proportion • Example 3: • A survey asked 346 job seekers. The answer selected most (152 times) was “higher compensation.” • What is the point estimate of the proportion of job seekers who would select “higher compensation” as the reason of changing jobs? • What is the 95% confidence interval estimate of the population proportion? • HWK: p.332 #35
Example 3: • Answer: • a. Point estimate of p: • b. Confidence interval: • Z: (1-)/2=0.475, Table 1 Z=1.96 • Margin of error = = 0.0523 • Confidence interval • p: [.3870, .4916]
III. Sample Size and Precision • Quality of estimation: • Confidence level: 1 - • Precision: margin of error • Confidence level: 1 - is guaranteed by procedure. • P.312 Figure 8.3: • sampling distribution for sample mean. • Probability that • is 1 - . In general, any sample mean that is within this range will provide an interval that contains the population mean . • Margin of error: • Given n, then (1 - ) margin of error . • Given 1 - , then n margin of error .
Determine sample size to meet requirements for both confidence level and margin of error: 1. Determine sample size for estimation of (p.326) E: desired margin of error [ ]: round up (“Be conservative”) 2. Determine sample size for estimation of p (p.330) p = .5 (p.319 Table 8.5 “Be conservative”) E: desired margin of error [ ]: round up (“Be conservative”) Homework: p.327 #25, p.332 #39
Example 4: • Bride’s magazine reported that the mean cost of a wedding is $19,000. Assume that the population standard deviation is $9,400. Use 95% confidence, • What is the recommended sample size if the desired margin of error is $1,000? • What is the recommended sample size if the desired margin of error is $500? • Answer: • a. • b.
Example 6: The League of American Theatres and Producers uses an ongoing audience tracking survey that provides up-to-date information about Broadway theater audiences. Every week, the League distributes a one-page survey on random theater seats at a rotation roster of Broadway shows. a. How large a sample should be taken if the desired margin of error on any proportion is 0.04? Use 95% confidence. Answer: