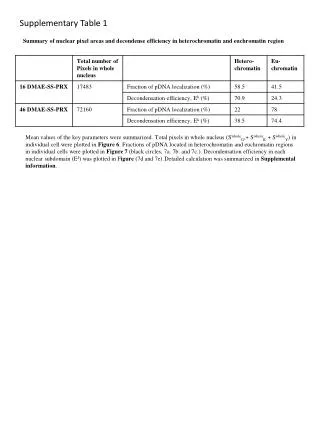
Download
1 / 20
200 likes | 304 Views
Pixel Efficiency in Overlap Region. Hemma Mistry Kevin Lung, Ana Ovcharova, Boyan Tabakov Weiming Yao, Jim Siegrist. URAP Project: Atlas Pixel Commissioning

E N D
Pixel Efficiency in Overlap Region Hemma Mistry Kevin Lung, Ana Ovcharova, Boyan Tabakov Weiming Yao, Jim Siegrist URAP Project: Atlas Pixel Commissioning Goal: Study pixel detector performances using pixel endcapA cosmic data and compare with Monte Carlo predictions in terms of pixel clustering, noise, resolution, and hit efficiencies as an undergraduate research project
Current Work • Check cluster width vs. Incident Angle • Check total cluster charge vs. Incident angle • Compare Data and Monte Carlo • Check hit efficiency in overlap region
Cluster Width X vs. Incident Angle • Cluster width in local x vs. incident angle of track passing through disk • Data agrees well with Monte Carlo noise X Projection Y Profile
Cluster Width Y vs. Incident Angle • Cluster width in local y vs. incident angle of track passing through disk • Data agrees well with Monte Carlo X Projection Y Profile
Cluster Charge vs. Incident Angle • Total cluster charge (ToT) vs. incident angle of track passing though disk • Shift between Data and Monte Carlo noise X Projection Y Profile
Checking Efficiency • Check hit efficiency in overlap regions • Plot local x vs. local y of active overlap region • Take hit on front of disk and extrapolate to back of disk to find expected hit • Check if expected hit is within overlap region • Check minimum distance between expected hit and real hit on module
Local X vs. Local Y Overlap Region - Even Modules Local y Local x
Local X vs. Local Y Overlap Region - Odd Modules Local y Local x
Local X vs. Local Y Overlap Region - Odd Modules Local y Local x
Local X vs. Local Y For Each Disk Even Modules -Disk 0 Even Modules -Disk 1 Even Modules -Disk 2 Odd Modules -Disk 0 Odd Modules -Disk 1 Odd Modules -Disk 2
Extrapolate Hit on Front of Disk to Back of Disk Disk 0 Disk 1 Disk 2 • For each hit on the front of second disk, calculate expected coordinates on back of disk • Check if within overlap region
Find Expected Hit on Back of Disk y YB y dz (XB, YB) (XA, YA) φ θ YA x z XA XB XA, YA is the hit on the front of the disk XB, YB is the expected hit on the back of the disk XB = XA + dz * tan(θ) * cos(φ) YB = YA + dz * tan(θ) * sin(φ)
Convert XB, YB to Local Coordinates • 7.5 degrees between each module • angle = (3.75+7.5*module) * π/180 • center of module: • X0 = 119.17 * cos(angle) • Y0 = 119.17 * sin(angle) Local x = (XB – X0) * cos(angle + π/2) +(YB – Y0) * sin(angle + π/2) Local y = (XB – X0) * sin(angle + π/2) -(YB – Y0) * cos(angle + π/2)
Local X vs. Local Y Overlap Region - Even Modules y < (-16/5)x – 35.6 y > -26 x < 8 Local y y > -26 x < 8 y < 8x – 50 Local x
Efficiency in Overlap Region Disk 1 dr = minimum distance between expected hit and actual pixel hit dr = (Δx2 + Δy2)½ dr
Efficiency Hits with dr < 1mm: 784 Total hits: 864 784 = .9074 +/- .01 864 90.74% dr < 1mm dr
Data Efficiency for Second Disk • Compare with Monte Carlo • Data agrees with Monte Carlo • Redefine fiducial region to see better efficiency dr Monte Carlo 80 = .9524 +/- .023 84 95.24 % dr < 1mm dr
Efficiency for Disk 0 Data 565 = .7125 +/- .016 793 71.25 % dr < 1mm dr Monte Carlo 72 = .8571 +/- .038 84 85.71 % dr < 1mm dr
Efficiency for Disk 2 Data 656 = .7024 +/- .015 934 70.25 % dr < 1mm dr Monte Carlo 66 = .7586 +/- .046 87 75.86 % dr < 1mm dr
To Do • Tighten fiducial region to see if efficiency remains the same • Check overlap efficiency as a function of the module in the disk • Check overlap resolutions as a function of the size of pixel clusters to make sure both clusters contain same number of pixels • Check global position of middle disk between other two disks