Download
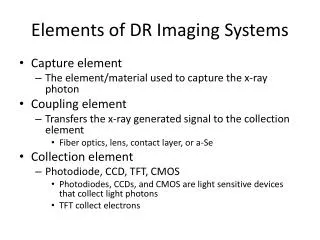
1 / 39
390 likes | 526 Views
Basics of Imaging systems. Lecture 1 prepared by Rick Lathrop 8/02. Basics of Imaging Systems & Remote Sensing. “Remote sensing is the science and art of obtaining information about an object,

E N D
Basics of Imaging systems Lecture 1 prepared by Rick Lathrop 8/02
Basics of Imaging Systems & Remote Sensing “Remote sensing is the science and art of obtaining information about an object, area, or phenomenon through the analysis of data acquired by a device that is not in contact with the object, area, or phenomenon under investigation”.- Lillesand & Kiefer (1987) Alternative term: Digital Image Analysis
The remote sensing process • Acquisition and analysis • Reading this viewgraph • eyes acquire the data, the brain processes it into information (I hope) • Aerial photography-the traditional means of remote sensing • Camera captures data with a lens system and chemical reactions on light sensitive films • Print is the storage and presentation media-eyes and brain process the data into useful information
Remote Sensing Model Remote sensing systems record reflected and/or emitted electromagnetic energy (i.e. light) as a 2D image. Of critical interest is how earth surface features (i.e. the target) interact and affect the reflected and/or emitted energy
The visible spectrum • The visible spectrum is only a tiny window • We are blind to 99.99% of the energy in the universe • One of the strengths of remote sensing is that we have created devices that allow us to see beyond the range of human vision
Framing systems Instantaneously acquire an image • Analog Camera - uses a lens to form an image at the focal plane. A shutter opens at selected intervals to allow light to enter, where the image is recorded on photographic film or an array of detectors • Digital Camera - type of camera that records an image on an 2D array of photosensitive detectors that is then recorded as a digital image file
Aerial photos The traditional form of remote sensing Pro: • Can be easily customized to meet specific requirements • Historical archive Con: • Can be expensive • Need access to plane • Visual interpretation Time consuming • Repeat coverage often infrequent • Different sun angles
Space-borne Remote Sensing • Emerging Technology • Pro: • GIS ready • faster turn around • acquisition time of 5 minutes gives equal solar illumination, shadows, no clouds • easy to repeat for change detection • Con: • Significant investment in computer hardware/software • Less flexibility in acquisition
Aerial photos: Film Types • Black & White: panchromatic (Visible) • Black & White Infrared: Near Infrared • Color: Visible – Blue, Green, Red • Color Infrared: Visible to Near Infrared
Primary Colors Red Green Blue
Subtractive Primary Colors Yellow (R+G) absence of blue Cyan (G+B) absence of red Magenta (R+B) absence of green
Color Additive Process R Y G W C M Black background B
Color Subtractive Process G Y C B B R M White background
Color film Original colors G R B Y M C Dye Layers B G R Film Image colors
Color Infrared film Original colors G R B NIR Filter Dye Layers Y M C B G R Film Image colors
Fundamental Recognition Elements • Shape • Size • Shadows - shape & height • Tone/Color • Texture • Pattern • Site • Association
Photointerpretation: Recognition Elements • Shape • cultural features - geometric, distinct boundaries • natural features - irregular shapes and boundaries • Shape helps us distinguish old vs. new subdivisions, some tree species, athletic fields, etc.
Photointerpretation: Recognition Elements • Size • relative size is an important clue • apartments vs. houses • single lane road vs. multilane
Photointerpretation: Recognition Elements • Shadows • shadows cast by some features can aid in their i.d. • some tree types, storage tanks, bridges can be identified in this way • shadows can also accentuate terrain Powerline transmission towers
Photointerpretation: Recognition Elements • Color/Tone • irrigated vs. dry fields, coniferous vs. deciduous trees An algae bloom in color An algae bloom in CIR
A color example-plant leaves • Chlorophyll absorbs large % of red and blue for photosynthesis- and strongly reflects in green (.55um) um • Peak reflectance in leaves in near infrared (.7-1.2um) up to 50% of infrared energy per leaf is scattered up or down due to cell wall size, shape, leaf condition (age, stress, disease), etc. • Reflectance in Mid IR (2-4um) influenced by water content-water absorbs IR energy, so live leaves reduce mid IR return • In a CIR photo, Hi NIR ------------> Hi Red Very Lo Red ------------> Very Lo Green Very Lo to Lo Green -----------> Very Lo to Lo Blue As a result due to the additive color processes, the color would be Red to Magenta
Spectral reflectance characteristics are both spatially and temporally variable. For example, each leaf is different and can change
Photointerpretation: Recognition Elements • Texture • coarseness/smoothness caused by variability or uniformity of image tone or color • smoothness - surface features of similar height: crops, bare fields, water, etc. • coarseness - irregular surface: forest, lava flows Helyar Woods and points south
Photointerpretation: Recognition Elements • Pattern • overall spatial form of related features • repeating simple geometric patterns tend to indicate cultural features • more complex, curving patterns tend to indicate natural features • drainage patterns can help geologists determine bedrock type A dendritic pattern is characteristic of flat-lying sedimentary bedrock
Photointerpretation: Recognition Elements • Site • site - relationship of a feature to its environment/location • oak on hillside, Atlantic. white cedar in stream corridor • Association • identifying one feature can help i.d. another - correlation • cooling towers, HT lines => power generating plant
Photo Interpretation and Mapping Objective: Turning imagery into mapped thematic information
Land Cover vs. Land Use • Land Cover (LC): the biophysical material covering the earth’s surface • Land Use (LU): how humans are using the land surface • Examples land cover: impervious surface land use: parking lot land cover: grass land use: recreational field
LU/LC Classification systems • Classification system: systematic categorization of LU or LC types • Often hierarchical progressing from the general to the specific, e.g., level I --> level II --> level III • Examples: USGS LU/LC (Anderson et al., 1976) Coastal Change Analysis Program (CCAP) USF&WS NWI (Cowardin et al., 1979)
Existing USGS Land Cover Products National Land Cover Dataset 1992 (NLCD 92) A U.S. land cover classification product based primarily on 1992 Landsat Thematic Mapper (TM) data. MRLC2000 (Multi-Resolution Land Characteristics 2000) Selected ETM+ and TM scenes (Landsats 7 and 5) from the National Land Cover Characterization 2000 project. Land Use and Land Cover Data (LULC) Historical U.S. land use and land cover data derived from 1970`s and 1980`s aerial photography. Global Land Cover Characterization (GLCC) A global land cover database primarily derived from 1992 to 1993 1-km AVHRR data. For more info: http://edc.usgs.gov/products/landcover.html
Photo Interpretation Keys • Selective: made up of typical illustrations and descriptions of objects in a given category • Elimination: hierarchical, requires the user to follow a step-by-step procedure, working from the general to the specific
Mapping Considerations • Uncontrolled maps: prepared at photo scale by direct tracing. Area measurements no more accurate than from the photos directly, depends on flatness of the terrain • Controlled maps: transfer onto planimetric base map of uniform scale. Needed for precise measurement of area. Better choice if available. • On-hard copy vs. On-screen: traditionally maps were drawn onto transparencies overtop hard copy photos, then digitized. Increasingly on-screen or heads-up digitizing is employed to directly capture maps in digital form in GIS.
Mapping Considerations • Decision Rules: rules for assigning features to thematic classes should be well defined, documented and followed to maximize consistency and help reduce subjectivity in a photointerpretation/mapping project. • Minimum Mapping Unit: smallest area of land that is mapped as a separate unit or entity, depends on scale & user requirements • Scale Restriction: often desirable to conduct photointerpretation/mapping at a consistent scale, so that all mapped features will have the same level of detail
Photo Interpreting Natural Vegetation Communities • Site is important determinant of the vegetation community type due to differences in microclimate and soil characteristics (e.g. texture, moisture status). I.e., certain community types are associated with certain site types. • Topoclimate: north-facing aspects have a colder microclimate than south-facing aspects • Soil Catena: ridge-tops are drier than valley bottoms
Photo Interpreting Natural Vegetation Communities • To identify trees to species type, often need to identify by crown shape - either from a vertical perspective or shadowed silhouette • Photo interpretation keys available for this purpose • Remember as scale changes from large to small the crown shape of individual trees eventually merges to form the overall texture of the forest canopy
Vegetation Mapping Applications • Forest stand mapping for timber evaluation - species identification - timber volume: density, canopy closure, tree height • Plant vigor, disease and stress detection • Wildlife habitat mapping • Outdoor recreation capability surveys
Major categories of urban land use • Industrial • Commercial/service • Transportation/utilities • Institutional (schools, government) • Residential • Recreational
Cultural Features Identification • Building size, shape and associated features • Major transportation routes: highways and rail-lines, canals/ports, airports • Street pattern and density • Open/green spaces: vegetation type and cover