Download

1 / 20
200 likes | 317 Views
Practice with Metric Measures. Which measure do I use and why?. Which measure do I use and why?. Examples of items to be measured in meters, liters and grams. The where for and how to!. Graphing Science Data. How to make and use graphs in science.

E N D
Examples of items to be measured in meters, liters and grams
The where for and how to! Graphing Science Data
How to make and use graphs in science • Graph – diagram that shows a relationship between 2 variables (independent versus dependent) • Graphing rules: • 1. title (tell what the graph is about) • 2. mark x and y axis (use numbers, letters…) • 3. label x and y axis (tell what units are used) • 4. date (is the data still relevant?) • Why use graphs? • They are easy to read • More appealing as visual/pictoral data • More memorable than qualitative (written) data
Line Graphs • Line graphs show a relationship b/w 2 variables that keep changing • X axis=independent variable (horizontal) • Y axis=dependent variable (vertical) • Steps: draw axes, label each, plot points, make best fit line or curve • You can have more than 1 line!
Bar Graphs • Compare data that does not continuously change • Use vertical bars to show the relationship • You can have more than one set of bars!
Circle graphs • Use sections of a circle to display percent data • Each section is a part of the whole • To get %=the # divided by the total #, then X 100 • To get degrees=divide # by total #, then X by 360 • Label each section and title
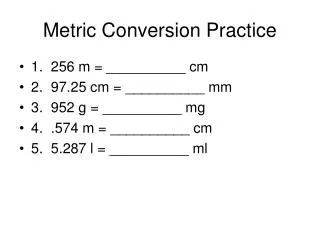
1. If you were planning a trip to Italy in October, and the average October temperature is 18 degrees Celsius, what clothes might you need to pack and why? Metric & American Standard conversion problems
2. If Olympic swim team members must swim in a 600 m relay race, how many km and mm are they swimming? Metric & American Standard conversion problems
3. What season might the people of Jamaica be having if the average monthly temperature of December is 34 degrees Celsius? Metric & American Standard conversion problems
4. If a 10 oz. bag of Doritos weighs 283.5 grams, how might you express this in hectograms and centigrams? Metric & American Standard conversion problems
5. If the average human body temperature is 98.6 degrees Fahrenheit, what might a medical professional in another country expect a patient’s temperature to be if they are not running a fever? Metric & American Standard conversion problems
6. American football fields are 100 yards in length. How could this be expressed in feet and inches? Too, if a European country wanted to make an American style field, how many meters must the field be in length? Metric & American Standard conversion problems
7. A certain cake recipe calls for 500 grams of flour and 250 mL of milk. How much flour and milk must an American pastry chef have if making this recipe? Metric & American Standard conversion problems