Download
1 / 19
190 likes | 313 Views
Where is the carrying capacity curve ?. Finite space & resources?. Resource consumption (80/20 rule). World Numbers (1992). Birth rate 26 Death rate 9 RNI (r) 1.6% Td 42 2010 7,041 (millions) 2025 8,425 (millions) TFR (children during child- bearing years

E N D
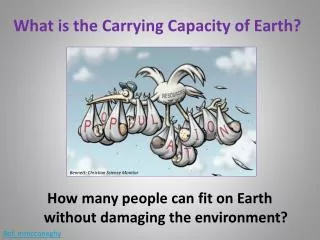
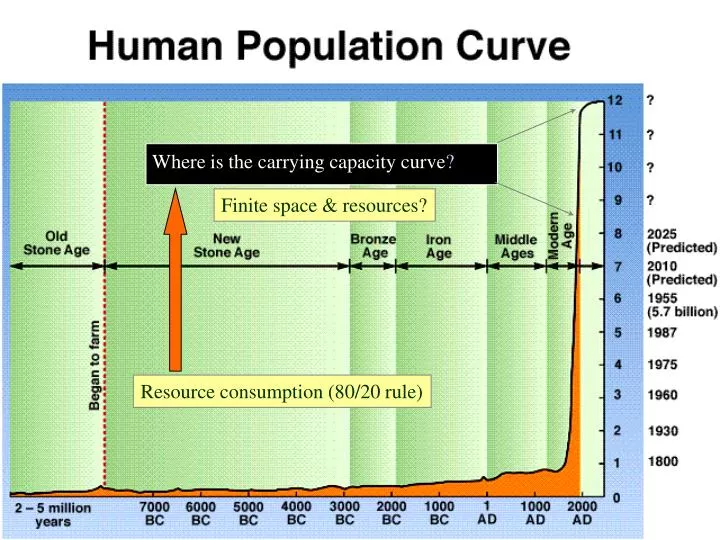
Where is the carrying capacity curve? Finite space & resources? Resource consumption (80/20 rule)
World Numbers (1992) • Birth rate 26 • Death rate 9 • RNI (r) 1.6% • Td 42 • 2010 7,041 (millions) • 2025 8,425 (millions) • TFR (children • during child- • bearing years • 15-49) 3.3 • % population • < 15/> 65 33/6 • Life exp. 65
2089 ZPG b = d As long as r decreases and TFR 2.1 by 2040! Latest projections: -- 9.2 billion in 2050 -- 0.76% r 2007-2050 Source: Cunningham/Saigo, Environmental Science, 1999.
POPULATION World M.D.C. L.D.C • Birth rate 22 11 29 • Death rate 9 10 9 • RNI (r) 1.24% 0.1% 1.9% • Td 56.5 809 36 • im 57 8 69 • TFR 2.9 1.5 3.7 • $ 4,890 19,480 1,450
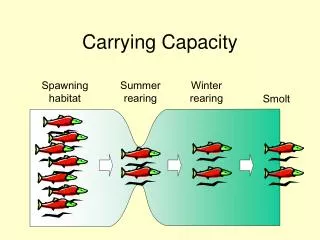
Habitat: Set TFR 6.9 - 3.1 in 20 yrs! TFR 6-1.8 in 15 yrs
The U.S. has 5% of the world’s population but consumes 30% of the world’s natural resource base. India, which last year topped 1 billion people, would seemingly cast a larger footprint on the planet with almost four times as many people as the U.S. population of 275 million, but it’s not even close. It’s estimated the average American has an environmental impact 40 times the impact of someone from a developing country like India.