Download

1 / 78
780 likes | 798 Views
Spectroscopy Introduction. UV Spectroscopy Introduction UV radiation and Electronic Excitations The difference in energy between molecular bonding, non-bonding and anti-bonding orbitals ranges from 125-650 kJ/mole

E N D
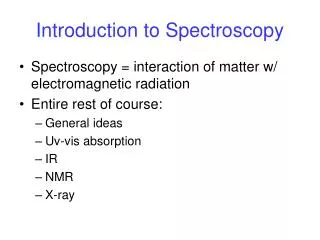
UV Spectroscopy • Introduction • UV radiation and Electronic Excitations • The difference in energy between molecular bonding, non-bonding and anti-bonding orbitals ranges from 125-650 kJ/mole • This energy corresponds to EM radiation in the ultraviolet (UV) region, 100-350 nm, and visible (VIS) regions 350-700 nm of the spectrum • For comparison, recall the EM spectrum: • Using IR we observed vibrational transitions with energies of 8-40 kJ/mol at wavelengths of 2500-15,000 nm • For purposes of our discussion, we will refer to UV and VIS spectroscopy as UV g-rays X-rays UV IR Microwave Radio Visible
UV Spectroscopy • Introduction • The Spectroscopic Process • In UV spectroscopy, the sample is irradiated with the broad spectrum of the UV radiation • If a particular electronic transition matches the energy of a certain band of UV, it will be absorbed • The remaining UV light passes through the sample and is observed • From this residual radiation a spectrum is obtained with “gaps” at these discrete energies – this is called an absorption spectrum
UV Spectroscopy • Introduction • Observed electronic transitions • The lowest energy transition (and most often obs. by UV) is typically that of an electron in the Highest Occupied Molecular Orbital (HOMO) to the Lowest Unoccupied Molecular Orbital (LUMO) • For any bond (pair of electrons) in a molecule, the molecular orbitals are a mixture of the two contributing atomic orbitals; for every bonding orbital “created” from this mixing (s, p), there is a corresponding anti-bonding orbital of symmetrically higher energy (s*, p*) • The lowest energy occupied orbitals are typically the s; likewise, the corresponding anti-bonding s* orbital is of the highest energy • p-orbitals are of somewhat higher energy, and their complementary anti-bonding orbital somewhat lower in energy than s*. • Unshared pairs lie at the energy of the original atomic orbital, most often this energy is higher than p or s (since no bond is formed, there is no benefit in energy)
UV Spectroscopy • Introduction • Observed electronic transitions • Here is a graphical representation s* Unoccupied levels p* Atomic orbital Atomic orbital Energy n Occupied levels p s Molecular orbitals
UV Spectroscopy • Introduction • Observed electronic transitions • From the molecular orbital diagram, there are several possible electronic transitions that can occur, each of a different relative energy: s* alkanes carbonyls unsaturated cmpds. O, N, S, halogens carbonyls s s p n n s* p* p* s* p* p* Energy n p s
UV Spectroscopy • Introduction • Observed electronic transitions • Although the UV spectrum extends below 100 nm (high energy), oxygen in the atmosphere is not transparent below 200 nm • Special equipment to study vacuum or far UV is required • Routine organic UV spectra are typically collected from 200-700 nm • This limits the transitions that can be observed: alkanes carbonyls unsaturated cmpds. O, N, S, halogens carbonyls 150 nm 170 nm 180 nm √ - if conjugated! 190 nm 300 nm √ s s p n n s* p* p* s* p*
UV Spectroscopy • Introduction • Selection Rules • Not all transitions that are possible are observed • For an electron to transition, certain quantum mechanical constraints apply – these are called “selection rules” • For example, an electron cannot change its spin quantum number during a transition – these are “forbidden” • Other examples include: • the number of electrons that can be excited at one time • symmetry properties of the molecule • symmetry of the electronic states • To further complicate matters, “forbidden” transitions are sometimes observed (albeit at low intensity) due to other factors
UV Spectroscopy • Introduction • Band Structure • Unlike IR (or later NMR), where there may be upwards of 5 or more resolvable peaks from which to elucidate structural information, UV tends to give wide, overlapping bands • It would seem that since the electronic energy levels of a pure sample of molecules would be quantized, fine, discrete bands would be observed – for atomic spectra, this is the case • In molecules, when a bulk sample of molecules is observed, not all bonds (read – pairs of electrons) are in the same vibrational or rotational energy states • This effect will impact the wavelength at which a transition is observed – very similar to the effect of H-bonding on the O-H vibrational energy levels in neat samples
UV Spectroscopy • Introduction • Band Structure • When these energy levels are superimposed, the effect can be readily explained – any transition has the possibility of being observed E1 Energy E0
UV Spectroscopy • Instrumentation and Spectra • Instrumentation • The construction of a traditional UV-VIS spectrometer is very similar to an IR, as similar functions – sample handling, irradiation, detection and output are required • Here is a simple schematic that covers most modern UV spectrometers: log(I0/I) = A I0 I UV-VIS sources sample 200 700 l, nm detector monochromator/ beam splitter optics I0 I0 reference
UV Spectroscopy • Instrumentation and Spectra • Instrumentation • Two sources are required to scan the entire UV-VIS band: • Deuterium lamp – covers the UV – 200-330 • Tungsten lamp – covers 330-700 • As with the dispersive IR, the lamps illuminate the entire band of UV or visible light; the monochromator (grating or prism) gradually changes the small bands of radiation sent to the beam splitter • The beam splitter sends a separate band to a cell containing the sample solution and a reference solution • The detector measures the difference between the transmitted light through the sample (I) vs. the incident light (I0) and sends this information to the recorder
UV Spectroscopy • Instrumentation and Spectra • Instrumentation • As with dispersive IR, time is required to cover the entire UV-VIS band due to the mechanism of changing wavelengths • A recent improvement is the diode-array spectrophotometer - here a prism (dispersion device) breaks apart the full spectrum transmitted through the sample • Each individual band of UV is detected by a individual diodes on a silicon wafer simultaneously – the obvious limitation is the size of the diode, so some loss of resolution over traditional instruments is observed Diode array UV-VIS sources sample Polychromator – entrance slit and dispersion device
UV Spectroscopy • Instrumentation and Spectra • Instrumentation – Sample Handling • Virtually all UV spectra are recorded solution-phase • Cells can be made of plastic, glass or quartz • Only quartz is transparent in the full 200-700 nm range; plastic and glass are only suitable for visible spectra • Concentration (we will cover shortly) is empirically determined • A typical sample cell (commonly called a cuvet):
UV Spectroscopy • Instrumentation and Spectra • Instrumentation – Sample Handling • Solvents must be transparent in the region to be observed; the wavelength where a solvent is no longer transparent is referred to as the cutoff • Since spectra are only obtained up to 200 nm, solvents typically only need to lack conjugated p systems or carbonyls • Common solvents and cutoffs: • acetonitrile 190 • chloroform 240 • cyclohexane 195 • 1,4-dioxane 215 • 95% ethanol 205 • n-hexane 201 • methanol 205 • isooctane 195 • water 190
UV Spectroscopy • Instrumentation and Spectra • Instrumentation – Sample Handling • Additionally solvents must preserve the fine structure (where it is actually observed in UV!) where possible • H-bonding further complicates the effect of vibrational and rotational energy levels on electronic transitions, dipole-dipole interacts less so • The more non-polar the solvent, the better (this is not always possible)
UV Spectroscopy • Instrumentation and Spectra • The Spectrum • The x-axis of the spectrum is in wavelength; 200-350 nm for UV, 200-700 for UV-VIS determinations • Due to the lack of any fine structure, spectra are rarely shown in their raw form, rather, the peak maxima are simply reported as a numerical list of “lamba max” values or lmax lmax = 206 nm 252 317 376
UV Spectroscopy • Instrumentation and Spectra • The Spectrum • The y-axis of the spectrum is in absorbance, A • From the spectrometers point of view, absorbance is the inverse of transmittance: A = log10 (I0/I) • From an experimental point of view, three other considerations must be made: • a longer path length, l through the sample will cause more UV light to be absorbed – linear effect • the greater the concentration, c of the sample, the more UV light will be absorbed – linear effect • some electronic transitions are more effective at the absorption of photon than others – molar absorptivity, e • this may vary by orders of magnitude…
UV Spectroscopy • Instrumentation and Spectra • The Spectrum • These effects are combined into the Beer-Lambert Law: A = e c l • for most UV spectrometers, l would remain constant (standard cells are typically 1 cm in path length) • concentration is typically varied depending on the strength of absorption observed or expected – typically dilute – sub .001 M • molar absorptivities vary by orders of magnitude: • values of 104-106 104-106 are termed high intensity absorptions • values of 103-104 are termed low intensity absorptions • values of 0 to 103 are the absorptions of forbidden transitions • A is unitless, so the units for e are cm-1· M-1 and are rarely expressed • Since path length and concentration effects can be easily factored out, absorbance simply becomes proportional to e, and the y-axis is expressed as e directly or as the logarithm of e
UV Spectroscopy • Instrumentation and Spectra • Practical application of UV spectroscopy • UV was the first organic spectral method, however, it is rarely used as a primary method for structure determination • It is most useful in combination with NMR and IR data to elucidate unique electronic features that may be ambiguous in those methods • It can be used to assay (via lmax and molar absorptivity) the proper irradiation wavelengths for photochemical experiments, or the design of UV resistant paints and coatings • The most ubiquitous use of UV is as a detection device for HPLC; since UV is utilized for solution phase samples vs. a reference solvent this is easily incorporated into LC design • UV is to HPLC what mass spectrometry (MS) will be to GC
UV Spectroscopy • Chromophores • Definition • Remember the electrons present in organic molecules are involved in covalent bonds or lone pairs of electrons on atoms such as O or N • Since similar functional groups will have electrons capable of discrete classes of transitions, the characteristic energy of these energies is more representative of the functional group than the electrons themselves • A functional group capable of having characteristic electronic transitions is called a chromophore (color loving) • Structural or electronic changes in the chromophore can be quantified and used to predict shifts in the observed electronic transitions
UV Spectroscopy • Chromophores • Organic Chromophores • Alkanes – only posses s-bonds and no lone pairs of electrons, so only the high energy s s* transition is observed in the far UV • This transition is destructive to the molecule, causing cleavage of the s-bond s* s
UV Spectroscopy • Chromophores • Organic Chromophores • Alcohols, ethers, amines and sulfur compounds – in the cases of simple, aliphatic examples of these compounds the n s* is the most often observed transition; like the alkane s s* it is most often at shorter l than 200 nm • Note how this transition occurs from the HOMO to the LUMO s*CN nN sp3 sCN
UV Spectroscopy • Chromophores • Organic Chromophores • Alkenes and Alkynes – in the case of isolated examples of these compounds the p p* is observed at 175 and 170 nm, respectively • Even though this transition is of lower energy than s s*, it is still in the far UV – however, the transition energy is sensitive to substitution p* p
UV Spectroscopy • Chromophores • Organic Chromophores • Carbonyls – unsaturated systems incorporating N or O can undergo n p* transitions (~285 nm) in addition to p p* • Despite the fact this transition is forbidden by the selection rules (e = 15), it is the most often observed and studied transition for carbonyls • This transition is also sensitive to substituents on the carbonyl • Similar to alkenes and alkynes, non-substituted carbonyls undergo the p p* transition in the vacuum UV (188 nm, e = 900); sensitive to substitution effects
UV Spectroscopy • Chromophores • Organic Chromophores • Carbonyls – n p* transitions (~285 nm); p p* (188 nm) p* It has been determined from spectral studies, that carbonyl oxygen more approximates sp rather than sp2 ! n p sCO transitions omitted for clarity
UV Spectroscopy • Chromophores • Substituent Effects • General – from our brief study of these general chromophores, only the weak n p* transition occurs in the routinely observed UV • The attachment of substituent groups (other than H) can shift the energy of the transition • Substituents that increase the intensity and often wavelength of an absorption are called auxochromes • Common auxochromes include alkyl, hydroxyl, alkoxy and amino groups and the halogens
UV Spectroscopy • Chromophores • Substituent Effects • General – Substituents may have any of four effects on a chromophore • Bathochromic shift (red shift) – a shift to longer l; lower energy • Hypsochromic shift (blue shift) – shift to shorter l; higher energy • Hyperchromic effect – an increase in intensity • Hypochromic effect – a decrease in intensity Hyperchromic e Hypsochromic Bathochromic Hypochromic 200 nm 700 nm
UV Spectroscopy • Chromophores • Substituent Effects • Conjugation – most efficient means of bringing about a bathochromic and hyperchromic shift of an unsaturated chromophore: lmax nme 175 15,000 217 21,000 258 35,000 465 125,000 n p* 280 12 p p* 189 900 n p* 280 27 p p* 213 7,100
UV Spectroscopy • Chromophores • Substituent Effects • Conjugation – Alkenes • The observed shifts from conjugation imply that an increase in conjugation decreases the energy required for electronic excitation • From molecular orbital (MO) theory two atomic p orbitals, f1 and f2 from two sp2 hybrid carbons combine to form two MOs Y1 and Y2* in ethylene Y2* f1 f2 Y1 p
UV Spectroscopy • Chromophores • Substituent Effects • Conjugation – Alkenes • When we consider butadiene, we are now mixing 4 p orbitals giving 4 MOs of an energetically symmetrical distribution compared to ethylene Y4* Y2* Y3* Y2 Y1 p Y1 DE for the HOMO LUMO transition is reduced
UV Spectroscopy • Chromophores • Substituent Effects • Conjugation – Alkenes • Extending this effect out to longer conjugated systems the energy gap becomes progressively smaller: Energy Lower energy = Longer wavelengths ethylene butadiene hexatriene octatetraene
UV Spectroscopy • Chromophores • Substituent Effects • Conjugation – Alkenes • Similarly, the lone pairs of electrons on N, O, S, X can extend conjugated systems – auxochromes • Here we create 3 MOs – this interaction is not as strong as that of a conjugated p-system Y3* p* Y2 Energy p nA Y1
UV Spectroscopy • Chromophores • Substituent Effects • Conjugation – Alkenes • Methyl groups also cause a bathochromic shift, even though they are devoid of p- or n-electrons • This effect is thought to be through what is termed “hyperconjugation” or sigma bond resonance
UV Spectroscopy • Next time – We will find that the effect of substituent groups can be reliably quantified from empirical observation of known conjugated structures and applied to new systems • This quantification is referred to as the Woodward-Fieser Rules which we will apply to three specific chromophores: • Conjugated dienes • Conjugated dienones • Aromatic systems
UV Spectroscopy • Structure Determination • Dienes • General Features • For acyclic butadiene, two conformers are possible – s-cis and s-trans • The s-cis conformer is at an overall higher potential energy than the s-trans; therefore the HOMO electrons of the conjugated system have less of a jump to the LUMO – lower energy, longer wavelength s-trans s-cis
UV Spectroscopy • Structure Determination • Dienes • General Features • Two possible p p* transitions can occur for butadiene Y2 Y3* and Y2 Y4* • The Y2 Y4* transition is not typically observed: • The energy of this transition places it outside the region typically observed – 175 nm • For the more favorable s-trans conformation, this transition is forbidden • The Y2 Y3* transition is observed as an intense absorption Y4* 175 nm –forb. 175 nm Y3* 217 nm 253 nm Y2 s-trans s-cis Y1
UV Spectroscopy • Structure Determination • Dienes • General Features • The Y2 Y3* transition is observed as an intense absorption (e = 20,000+) based at 217 nm within the observed region of the UV • While this band is insensitive to solvent (as would be expected) it is subject to the bathochromic and hyperchromic effects of alkyl substituents as well as further conjugation • Consider: lmax = 217 253 220 227 227 256 263 nm
UV Spectroscopy • Structure Determination • Dienes • Woodward-Fieser Rules • Woodward and the Fiesers performed extensive studies of terpene and steroidal alkenes and noted similar substituents and structural features would predictably lead to an empirical prediction of the wavelength for the lowest energy p p* electronic transition • This work was distilled by Scott in 1964 into an extensive treatise on the Woodward-Fieser rules in combination with comprehensive tables and examples – (A.I. Scott, Interpretation of the Ultraviolet Spectra of Natural Products, Pergamon, NY, 1964) • A more modern interpretation was compiled by Rao in 1975 – (C.N.R. Rao, Ultraviolet and Visible Spectroscopy, 3rd Ed., Butterworths, London, 1975)
UV Spectroscopy • Structure Determination • Dienes • Woodward-Fieser Rules - Dienes • The rules begin with a base value for lmax of the chromophore being observed: • acyclic butadiene = 217 nm • The incremental contribution of substituents is added to this base value from the group tables:
UV Spectroscopy • Structure Determination • Dienes • Woodward-Fieser Rules - Dienes • For example: • Isoprene - acyclic butadiene = 217 nm • one alkyl subs. + 5 nm • 222 nm • Experimental value 220 nm • Allylidenecyclohexane • - acyclic butadiene = 217 nm • one exocyclic C=C + 5 nm • 2 alkyl subs. +10 nm • 232 nm • Experimental value 237 nm
UV Spectroscopy • Structure Determination • Dienes • Woodward-Fieser Rules – Cyclic Dienes • There are two major types of cyclic dienes, with two different base values • Heteroannular (transoid): Homoannular (cisoid): • e = 5,000 – 15,000 e = 12,000-28,000 • base lmax = 214 base lmax = 253 • The increment table is the same as for acyclic butadienes with a couple additions:
UV Spectroscopy • Structure Determination • Dienes • Woodward-Fieser Rules – Cyclic Dienes • In the pre-NMR era of organic spectral determination, the power of the method for discerning isomers is readily apparent • Consider abietic vs. levopimaric acid: abietic acid levopimaric acid
UV Spectroscopy • Structure Determination • Dienes • Woodward-Fieser Rules – Cyclic Dienes • For example: • 1,2,3,7,8,8a-hexahydro-8a-methylnaphthalene heteroannular diene = 214 nm • 3 alkyl subs. (3 x 5) +15 nm • 1 exo C=C + 5 nm • 234 nm • Experimental value 235 nm
UV Spectroscopy • Structure Determination • Dienes • Woodward-Fieser Rules – Cyclic Dienes • heteroannular diene = 214 nm • 4 alkyl subs. (4 x 5) +20 nm • 1 exo C=C + 5 nm • 239 nm • homoannular diene = 253 nm • 4 alkyl subs. (4 x 5) +20 nm • 1 exo C=C + 5 nm • 278 nm
UV Spectroscopy • Structure Determination • Dienes • Woodward-Fieser Rules – Cyclic Dienes • Be careful with your assignments – three common errors: This compound has three exocyclic double bonds; the indicated bond is exocyclic to two rings This is not a heteroannular diene; you would use the base value for an acyclic diene Likewise, this is not a homooannular diene; you would use the base value for an acyclic diene
UV Spectroscopy • Structure Determination • Enones • General Features • Carbonyls, as we have discussed have two primary electronic transitions: p* Remember, the p p* transition is allowed and gives a high e, but lies outside the routine range of UV observation The n p* transition is forbidden and gives a very low e, but can routinely be observed n p
UV Spectroscopy • Structure Determination • Enones • General Features • For auxochromic substitution on the carbonyl, pronounced hypsochromic shifts are observed for the n p* transition (lmax): 293 nm This is explained by the inductive withdrawal of electrons by O, N or halogen from the carbonyl carbon – this causes the n-electrons on the carbonyl oxygen to be held more firmly It is important to note this is different from the auxochromic effect on p p* which extends conjugation and causes a bathochromic shift In most cases, this bathochromic shift is not enough to bring the p p* transition into the observed range 279 235 214 204 204
UV Spectroscopy • Structure Determination • Enones • General Features • Conversely, if the C=O system is conjugated both the n p* and p p* bands are bathochromically shifted • Here, several effects must be noted: • the effect is more pronounced for p p* • if the conjugated chain is long enough, the much higher intensity p p* band will overlap and drown out the n p* band • the shift of the n p* transition is not as predictable • For these reasons, empirical Woodward-Fieser rules for conjugated enones are for the higher intensity, allowed p p* transition
UV Spectroscopy • Structure Determination • Enones • General Features • These effects are apparent from the MO diagram for a conjugated enone: Y4* p* p* Y3* n n Y2 p p Y1