Download
1 / 29
290 likes | 437 Views
The Search for Oscillations at Super-Kamiokande I. Kenneth S. Ganezer for the Super-Kamiokande Collaboration Thursday September 20, 2007. Physics Department California State University Dominguez Hills, Carson, CA 90740.

E N D
The Search for Oscillations at Super-Kamiokande I Kenneth S. Ganezer for the Super-Kamiokande Collaboration Thursday September 20, 2007 Physics Department California State University Dominguez Hills, Carson, CA 90740 International Workshop on the Search for Baryon and Lepton Number Violation Building 50 Auditorium Lawrence Berkeley National Laboratory One Cyclotron Road, Berkeley , CA 94720-8158 September 20-22, 2007 With much help from the other Members of the SK nnbar group Brandon Hartfiel, J. S. Jang, and Jun Kameda
Outline • Introduction and Motivation (theoretical and experimental) • A very brief description of the Super-Kamiokande Detector • Analysis for (a) the n-nbar signal Monte Carlo (b) the atmospheric neutrino background Monte Carlo, and (c) the Super-K data. • Analysis of Systematic Uncertainties (errors). • Calculation of limits and comparison with previous results • Conclusions
Some GUTs such as minimal SU (5), minimal Super-Symmetric Models, and some B-L conserving models have been ruled out by nucleon decay experiments. • Neutrino Oscillations and relatively small neutrino masses are best explained by the see-saw mechanism which is included in B-L violating left-right symmetric models that also predict neutron oscillations as well as neutrino-less double beta decay. • Baryogenesis and the Baryon Asymmetry of the Universe (BAU) may be explained by theories that allow neutron oscillations. • Some Theories with extra dimensions allow neutron oscillations. • There have been no new results published on neutron oscillations in water Cherenkov counters in over 20 years.
Ex. ; New low quantum gravity scale models – N.Arkani Hamed(1998) • p→e+p0 : The intermediate mass scale is 1015GeV • n↔ n is observable in the mass range of 105~106GeV • (In between the SM and GUT scales) n→ n transition in SO(10) SU(2)L×SU(2)R×SU(4)C Proton decay in minimal SU(5) R. N. Mohapatra, hep-ph/9604414
Experimental methods for n↔ n searches • and previous limits. • Use free neutrons from reactors or neutron spallation sources • or neutrons bound in nuclei • Experimental lower limits at the 90% CL Experiment Year Source of neutrons Exposure [NnT] (1032 neutron-yr) Limit [t] (1032yr) Suppression Factor [R] (1023s-1) Limit [Tfree] (108s) ILL 1990 Reactor beam - - - 0.86 Soudan 2 2002 56Fe 21.9 0.72 1.4 1.3 Frejus 1990 56Fe 5.0 0.65 1.4 1.2 Kamokande 1986 16O 3.0 0.43 1.0 1.2 tbound = R×(Tfree)2 C.B.Dover et al. Phys. Rev. D 27 (1983) 1090
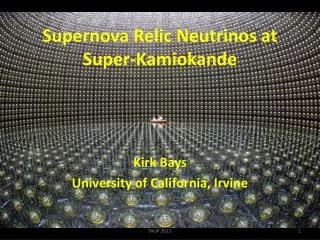
Super-Kamiokande (Super-K) • The world’s largest water Cherenkov detector, observing neutrinos from the Sun, atmosphere, astrophysical sources, and accelerator beams as well as searching for nucleon decay. • Collaborators ; Japan(17 institutes), USA(14), Poland(1), Korea(3), China(1) 50ktons water, diameter: 40m, height: 40m Inner PMTs:11,146(50 cm) Inner Detector PMTs:1,885(20cm) Outer Detector
The Super-K Detector • 22.5 Kton fiducial volume • 2,700 m water equivalent overburden • 11,146 inner detector PMTs • 1,885 outer detector PMTs • SK1 4.1 yr (this analysis) • SK2 ~ 2 yr (1/2 PMTs) • SK3 ~ 1 yr • 2.2 nsec timing • Can see neutrino interactions at energies as low as 4.5 or 5 MeV
Monte Carlo simulations of n↔ n 1. The Oscillation phase 2. The Annihilation phase With Fermi momentum 3. Pionization phase Branching ratios Horowitz et Al., Phys Rev. 115 (2), 1959 and Armenteros, 1983 p p+ p0 p0 Oxygen 16 16O8 annihilation or p- ω0 p+ p n 5. Fragmentation phase 4. The pion propagation phase with Nuclear effects D. Ashery, Nucl. Phys. A354, 555 (1981). p+ p+ p 2H p0 p0 p n 4He p0 p0 p0 p+ p0 ω0 p- 3He n p-
Branching Ratios n pbar annihilations (from pbar deuterium data) p pbar annihilations (use isospin invariance) Decays are according to phase space (Genbod) more recent p-pbar branching ratios in astro-ph/0005419 kaons 7% eta 3% won’t change our results Leads to 5.2% uncertainty in final efficiency
Pion (and Omega) Propagation • Pions propagate through the residual nucleus in .2 fm steps. • Total pion-nucleus cross section is taken from scattering experiments and distributed throughout the residual nucleus according to the nuclear density • Cross section peak due to D(1232) resonance 25% of pions absorbed 25%scattered 2.2 charged 1.3 neutral pions escape About 5 pions (7.4 rings) before and 3.5 pions (5.1 rings) after propagation (preliminarily). Reconstruction yields 3.5 rings on average (will show this). Leads to 12.5% uncertainty in final efficiency
NNBAR Data Analysis in Super-K I (Apr.1996-Jul.2001) Data (12180events/1489.2days) Atmospheric n MC (36525days) n↔ n MC (5000events) Fully contained events are used. Atmospheric n MC is used for background studies. Optimization of selection criteria Detector Simulation & Reconstruction Detection efficiency, number of candidates, and background Data selection Systematic uncertainty estimation Uncertainties in efficiency and background rate Oscillation time limit calculation including the systematic uncertainties Using Bayesian statistics First estimation
Reconstructed events Number of rings (Nring) Total momentum (Ptot) Visible energy (Evis) Total invariant mass (Mtot)
Selection of candidate events Selection criteria is chosen to optimize the efficiency of n↔ n events divided by the number of background (atmospheric n events) Chosen to optimize ε/b (a) Nring > 1 (b) 700< Evis (MeV) <1300 (c) 0< Ptot (MeV/C) <450 (d) 750< Mtot (MeV/C2) <1800 eliminates 64% background events
Event selection criteria (cuts) (a) Nring > 1 (b) 700< Evis (MeV) <1300 (c) 0< Ptot (MeV/C) <450 (d) 750< Mtot (MeV/C2) <1800
Detection efficiency Data (%) Criteria atm. nMC (%) n↔ n MC (%) 5000 Ninitial in FV 12968 12180 Nring 4668.66 (36.0) 4275 (85.5) 3865 (31.7) Evis 1673 (33.5) 731 (6.0) 907.628 (7.0) Ptot & Mtot 21.3056 (0.16) 521 (10.4) 20 (0.16) 100years atm. n MC is normalized by detector livetime (1489.2days) 20 n↔ ncandidates 10.4 % detection efficiency 21.3 background events
The Detection efficiency Data (%) Criteria atm. nMC (%) n↔ n MC (%) 5000 Ninitial in FV 12968 12180 Nring 4668.66 (36.0) 4275 (85.5) 3865 (31.7) Evis 1673 (33.5) 731 (6.0) 907.628 (7.0) Ptot & Mtot 21.3056 (0.16) 521 (10.4) 20 (0.16) The atmospheric n MC considered the effects of neutrino oscillations normalized by detector livetime (1489.2 days) as follows:
Systematic uncertainties Systematic uncertainties in the efficiency and exposure Systematic uncertainties in the background rate - : negligible (less than 0.1%)
The oscillation limits including systematic uncertainties n n oscillation probability ,P(G|n) is calculated by Bayesian statistics. n : # of candidate events G: decay rate l: detector exposure e: detection efficiency b: # of background (BG) event Each probability ,P(G), P(l), P(e),and P(b)was calculated considering systematic errors as follows ; l: detector exposure l0: estimated detector exposure sl: uncertainty of exposure e:detection efficiency e0:estimated detection efficiency se:uncertainty of efficiency b:# of BG event C:oversampling factor of BG sb:uncertainty of BG bMC:# of true mean BG MC events nb: # of BG MC events
Our Results The total Systematic uncertainty in the efficiency and exposure : 15.2 %. The total Systematic uncertainty in the background rate : 32.1%. The lifetime lower limit for a neutron bound in 16O,tbound,is calculated to be: = 1.77×1032 yrs ( 90% CL ). This result can be translated to the oscillation time for free neutrons using tbound=R×(Tfree)2 with R=1.0x10²³ s-1 : the nuclear suppression factor. C. B. Dover et al. Phys. Rev. D 27 (1983) 1090 Tfree > 2.36×10⁸ s ( 90% CL )
Current Super-K I limits compared with previous results Suppression Factor [R] (1023s-1) Experiment Source of neutron Exposure (1032 neutron-yr) Eff. (%) Cand. BG Signal Limit Limit [t] (1032 yr) Limit [Tfree] (108 s) Super-K I 16O 245.4 10.4 20 21.3 8.1 1.77* 1.0 2.36* ILL Reactor beam - - - - - - - 0.86 Sudan 2 56Fe 21.9 18.0 5 4.5 5.5 0.72 1.4 1.3 Frejus 56Fe 5.0 30.0 0 4.0 2.3 0.65 1.4 1.2 Kamokande 16O 3.0 33.0 0 0.9/yr 2.3 0.43 1.0 1.2 * includes systematic uncertainties
A search for neutron-antineutron oscillation, a process with |D(B-L)|=2, was undertaken using the full 24.5×1033 neutron-yr exposure from the full Super-K I data set. This is the first neutron oscillation measurement to incorporate most major sources of experimental uncertainties in its limit calculation and the first result from water a Cherenkov detector in more than 20 years. The lower limit on the oscillation lifetime for neutrons bound in 16O has been determined to be 1.77 × 1032 yrs at the 90% CL, using Bayesian statistics. This limit is higher than the previous best limit for bound neutrons, of 0.72 × 1032 yrs from Soudan 2, by a factor of 2.5. At the 90% CL, the lower limit for the oscillation time for free neutrons has been calculated to be 2.36×10⁸ s using a suppression factor of 1.0 × 10²³ s-1. This is an improvement over the previous best 1imits of 0.86 ×10⁸ s and 1.3 ×10⁸ s from ILL and Soudan 2 (in 56Fe) of factors of 2.7 and 1.8, respectively. Even though the inclusion of systematic errors decreases lower limits, the limits we obtained are significantly higher than those of previous neutron oscillation experiments.