Download
1 / 17
170 likes | 300 Views
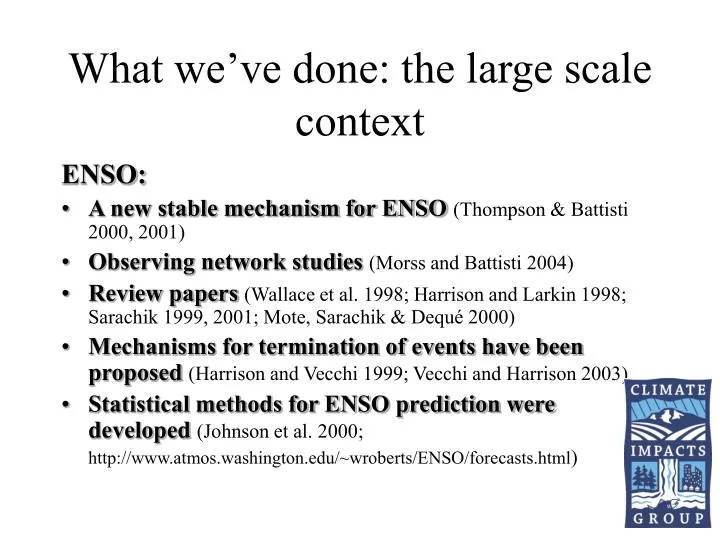
What we’ve done: the large scale context. ENSO: A new stable mechanism for ENSO (Thompson & Battisti 2000, 2001) Observing network studies (Morss and Battisti 2004) Review papers (Wallace et al. 1998; Harrison and Larkin 1998; Sarachik 1999, 2001; Mote, Sarachik & Dequé 2000)

E N D
What we’ve done: the large scale context ENSO: • A new stable mechanism for ENSO(Thompson & Battisti 2000, 2001) • Observing network studies(Morss and Battisti 2004) • Review papers(Wallace et al. 1998; Harrison and Larkin 1998; Sarachik 1999, 2001; Mote, Sarachik & Dequé 2000) • Mechanisms for termination of events have been proposed(Harrison and Vecchi 1999; Vecchi and Harrison 2003) • Statistical methods for ENSO prediction were developed(Johnson et al. 2000; http://www.atmos.washington.edu/~wroberts/ENSO/forecasts.html)
What we’ve done : the large scale context Pacific Decadal Climate Variability: • Documented the characteristics of tropical interannual versus extratropical interdecadal Pacific climate variability(Zhang, Wallace and Battisti 1997) • Established and synthesized strong links between interdecadal changes in Pacific salmon production and Pacific climate, and in the process named the Pacific Decadal Oscillation(Mantua et al. 1997) • PDV Review papers(Mantua 2001, Mantua and Hare 2002, Sarachik and Vimont 2003) • Mechanisms for PDV in a coupled climate model(Vimont et al. 2001, 2003) and the Seasonal Footprinting Mechanism (Vimont et al. 2003)
What we’ve done : the large scale context • Named the Arctic Oscillation “AO” (Thompson & Wallace 2000) • Identified AO links to extreme weather events and North America’s climate predictability (Thompson et al. 2002; Wallace and Thompson 2002; Thompson and Wallace 2001) • Identified mechanisms that weaken the thermohaline circulation and THC links to the Pacific thermocline and ENSO (Kamenkovich et al. 2003; Kamenkovich and Sarachik 2004; Huang et al. 2000; Goodman and Sarachik, in review) • Established links between tropical intraseasonal variability and west coast precip(Bond and Vecchi 2003; Vecchi and Bond, in press)
What we’ve done: regional foci Trends in NW temperature, precipitation, and snow • Mote, 2003, Can. Wat. Res. J.; Mote, 2003, Northwest Science Trends in Western North America’s snow, temperature and precipitation: • Mote et al., (in press), Bull. of the Amer. Meteorol. Soc. Climate and Western Wildfire: • McKenzie et al.,2004, Cons. Biol.; Gedalof et al. (in press), Ecol. Appl. Paleoclimate • Gedalof et al. (2003): Paleo PDO reconstruction. GRL • Gedalof et al. (in press): Columbia R. flow since 1750. JAWRA; • Strom et al. (2004): NE Pacific SSTs (from Geoduck shell growth) to 1850s. Geophys. Res. Letts.
Area-weighted Regional Avg=1.5 F/century USHCN stations Circles: significant at p<0.05 + signs: warming but not statistically significant Area Averaged warming 1.5F/100 yrs
Extrapolations are based on IPCC CO2 scenarios and observed sensitivity
Relative trends in April 1 snow water equivalent 1950-1997 To appear in BAMS, January 2005
What we plan to do Support regional climate impacts studies • Regionally focused climate diagnostics • Better quantify links between tropical intraseasonal weather and NW precipitation • Quantify statistics of extreme temperature (heat waves and cold spells), precipitation, and very low summer streamflow periods • Regional climate modeling and downscaling • Downscaling NCEP/CPC seasonal forecasts in collaboration with the Scripps ECPC • Downscaling IPCC climate change scenarios
What we plan to do Improve hydrologic forecasts • Link PNA forecasts to precipitation forecasts • Improve 2-week streamflow forecasts with enhanced skill in precipitation predictions • Improve seasonal streamflow forecasts with improved methods for 1st 2 week’s precipitation simulations • Examine the predictability of watershed-scale hydrologic extremes • Do SST-based large-scale drought forecasts have skill at regional scales?
What we plan to do Examine Hydroclimate trends for the west from data and from a simulation model (VIC) at 1/8 degree resolution for 1916-2003. • Examine timing of snowmelt and streamflow changes using VIC and observations • Determine causes for observed changes: How much trend is explained by precipitation changes? How much is explained by temperature change? What are the local/regional sensitivities to T and P? • Impacts of past and future climate change on Northwest ski areas
Products • Downscaled Data products • Historical, seasonal forecasts, and future climate change scenarios (access via our Live Access Server) • Seasonal ENSO forecasts http://www.atmos.washington.edu/~wroberts/ENSO/forecasts.html • PNA-based risk-assessment maps to be used with NCEP’s long-lead ensemble PNA forecasts
The function of the State Climatologist is to collect, disseminate, and interpret climate data.
integration • Making the global/large scale climate connection to regional resource impacts • S/I forecasts stream flows and reservoir inflows, coho ocean survival rates • Climate change scenarios basin-specific runoff changes, salmon survival changes, drought and fire risk, hydropower, irrigation, fish flow, changes in municipal water supplies and demands • Paleoclimate and paleo-resource reconstructions to better understand natural variability in NW climate and resources
Extreme Events Risk Forecasting • Experimental 7-14 day extreme weather event risk assessment forecasts available for the PNW. • Based on observed relationships between the probability of certain extreme weather events in the US and variations in Pacific North American atmospheric circulation pattern. • Forecasts include probabilities for: • Extreme warm/cold days, days with extremely high precip, heavy snowfall events • Benefit: aids extreme events management High snow events are 2-4+ times more likely during negative PNA than positive PNA, depending on location http://www.cses.washington.edu/cig/fpt/extreme.shtml
Changes in Simulated April 1 Snowpack for the Cascade Range in Washington and Oregon Current Climate “2020s” (+1.7 C) “2040s” (+ 2.5 C) -44% -58% April 1 SWE (mm)
Transient SWE simulation from HadCM3 (A2) GCM run (with running 10 year average smoothing) • Simulated from observed climate shows a declining trend of ~3KAF per decade (1935-2000) • HadCM3 simulated declines ~4KAF per decade Figure courtesy of Matt Wiley and Richard Palmer at CEE, UW
Climate and Wildfire 1. Climate Matters Region wide increases in area burned are characterized by antecedent drought accompanied by persistent blocking events 2. Ecology Matters Underlying ecology appears to modulate the response to drought and circulation 3. Relationships are non-linear Small changes in mean climate may lead to dramatic changes in wildfire activity H June H July H Aug Big NW fire year composites