Download
1 / 39
390 likes | 517 Views
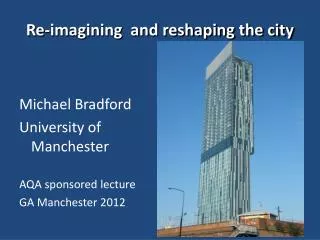
Reshaping Cities: What can be done?. Professor Ivan Turok Human Sciences Research Council. Outline. The national context Diverse local contexts Patterns and trends Explanations Policies. Renewed interest in spatial matters.

E N D
Reshaping Cities:What can be done? Professor Ivan Turok Human Sciences Research Council
Outline • The national context • Diverse local contexts • Patterns and trends • Explanations • Policies
Renewed interest in spatial matters • Our people still have to daily confront the impact of urban segregation. Many still live in areas once designated for black people away from economic opportunities and civic services (President Zuma, 2010) • Spatial challenges continue to marginalize the poor … the situation has probably been aggravated since 1994, with many more people now living in poorly located settlements … The capacity of municipalities to plan effectively is a significant challenge that needs to be addressed, supported by the efforts of national and provincial government” (NPC, 2011) • The cost of living is an important contributor to wage levels. Diffuse settlement patterns and weak public transport systems undermine job search and the ‘cost of working’ (NPC, 2011)
Spatial dislocation between jobs and population is the key issue
Big cities have seen the biggest increase in the employment rate, despite in-migration
Regional inequalities translate into urban inequalities • ‘Regional’ = former Bantustans versus metropolitan areas • ‘Urban’ = townships versus suburbs ‘Adjustment’ via migration and commuting is very normal but complicated in SA
As a result, spatial frictions compound poverty and inequality • Distance from jobs – ‘spatial mismatch’ • Exclusion from well-located land • RDP housing policy • Transport subsidies to workers
‘Area effects’ of concentrated poverty • Inferior basic services • Other facilities under extreme pressure • Vulnerability to fire, crime, disease • Social networks & access to information • Peer effects & socialisation Impedes upward mobility – inter-generational
Location of growth (2001-05)(Source: Sinclair-Smith & Turok)
Spatial dislocation matters for the economy and environment too • Imbalance creates excess travel & congestion • Cost of transport subsidies • Dispersed bulk infrastructure • Overheated property markets • Adverse environmental impacts • Cost of regular township disasters • Weaker place attachment, asset investment
Explanations • Housing • Employment • Transport subsidies
Reasons for poorly located housing • Low household incomes relative to cost of land • Existing property owners fear of shacks • Constitutional property rights • Passive public sector land owners • Better availability of greenfield sites • Lower cost of developing greenfield sites • Lack of creativity in house-building industry & among planners & regulators(?)
Reasons for remote employment locations • Inertia in established employment centres • Central locations to maximise labour pool via public transport • Shared services and infrastructure • Maintaining property values • Concerns about safety and security • Proximity to home of business owners • Sheer prejudice and herd instinct!
Policy responses • People closer to the jobs • Subsidised well-located land & housing • Acceptance, gradual upgrading & expansion of well-located informal settlements • Support services to enable labour market and progression – info, advice, skills, childcare • Mixed-use development & cross-subsidies • Wider spectrum - housing ladder
Policy responses • Jobs closer to the people • Township economic development with priority area status in and around • Land, infrastructure, premises • Small business advice & financial support • Public procurement & supply chain devt. • Public Works & Community Works Prog. • Need + potential
Policy responses • Improved public transport systems • Efficient, low cost commuting • Densification of transport corridors to knit together the built environment • Active zoning, incentives, guidance
Big opportunity with devolution of housing and transport powers to the metros (& SPLUMB?) Can you rise to the challenge?
3 forms of spatial planning • ‘Spatially-blind’ - neutral • Not explicit, reactive to market & events • Reproduces dislocations and inequalities • ‘Spatial targeting’ – concerted government action • Coordinated infrastructure, regulation, incentives … • Parachuting in, big projects, not embedded/sustainable • ‘Integrated place-based’ - horizontal & vertical alignment • Driven by local needs and potential, local energy and initiative • Building indigenous capabilities, developing linkages, partnership, negotiating transitions to green and inclusive economy
More research • Changing employment locations (by sector etc) • Shifting population (by skill, age, gender etc) • Changing land-use patterns • Underlying drivers • Creative use of planning & infrastructure policies