Download
1 / 20
200 likes | 441 Views
North Carolina SPF SIG:. Bringing the Big Picture into. Focus, Part I. Bringing the Big Picture into. (or….Why Are We Here?). NC SPF SIG Learning Community Durham, NC August 25 - 26, 2009. www.ncspfsig.org. OVERVIEW What is the SPF State Incentive Grant?.

E N D
North Carolina SPF SIG: Bringing the Big Picture into Focus, Part I Bringing the Big Picture into (or….Why Are We Here?) NC SPF SIG Learning Community Durham, NC August 25 - 26, 2009 www.ncspfsig.org
OVERVIEW What is the SPF State Incentive Grant? • SAMHSA’s major SPF demonstration • Center for Substance Abuse Prevention’s flagship initiative • Five-year cooperative agreements from CSAP (up to $2.35 M per year) • Currently in nearly all States/Territories/Tribal Organizations • Fund Distribution: • 85% of funds to Communities • 15% of funds for State administration (including evaluation) • Key components • State advisory board (Cooperative Agreement Advisory Board, CAAB) • State epidemiological workgroup (SEW) • Data driven planning to set state/local priorities • Outcome-based prevention using evidence-based strategies • Five-step SPF process….
Oh my gosh…. he’s going to show us that figure again!!!
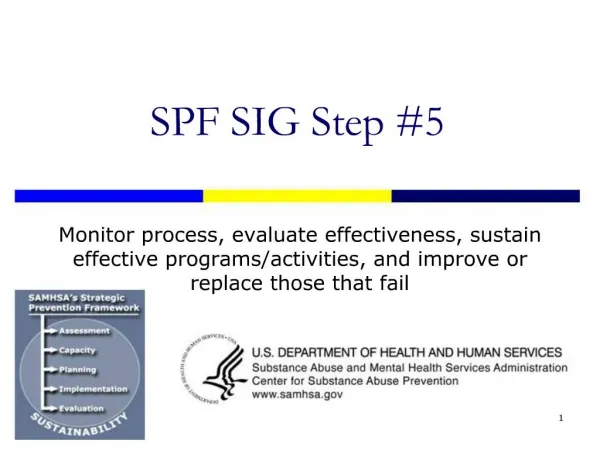
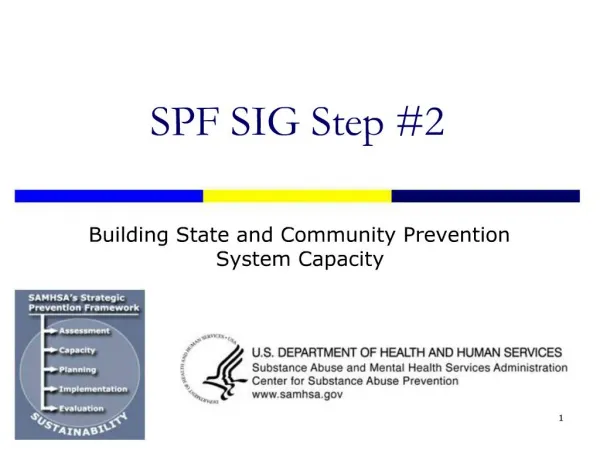
SAMHSA Strategic Prevention FrameworkState and Community Levels Profile population needs, resources, and readiness to address needs and gaps Cultural Competence & Sustainability Monitor, evaluate, sustain, and improve or replace those that fail Mobilize and/or build capacity to address needs Implement evidence-based prevention programs and activities Develop a Comprehensive Strategic Plan 1. Assess 2. Build Capacity 5. Monitor, evaluate 3. Plan 4. Implement
NC SPF SIG Steps and Timeline State Level Needs Assessment 2005-06 Capacity Building 2005 - EoP Strategic Planning 2006-07 Implementation 2007 - EoP Evaluation 2005 - EoP Needs Assessment 2007-08 Capacity Building 2007- EoP Strategic Planning 2007-08 Implementation 2008 – 09 2009 – 10 2010 – 11 Evaluation 2007 - EoP Community Level
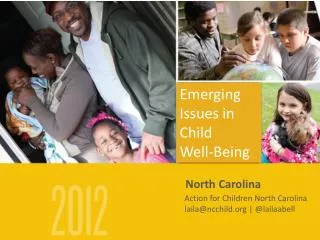
North Carolina SPF-SIG Goals Use data across the SPF steps to improve decision making, with the goals of… • Reducing and preventing alcohol-related traffic crashes and deaths in 18 high-need communities • Reducing the factors (intervening variables) that contribute to alcohol-related traffic crashes and deaths • Building prevention capacity/infrastructure at state and community levels
Community Accomplishments To-Date • Collected data on the needs of your communities, including (hopefully) cultural needs and considerations • Prioritized those data around key intervening variables and contributing factors • Developed strategic plans for addressing contributing factors • Created logic model to connect contributing factors with strategies • Began implementation
North Carolina SPF SIG: Bringing the Big Picture into Focus, Part II Bringing the Big Picture into (or….The Cost of ARTCDs in NC) NC SPF SIG Learning Community Durham, NC August 25 - 26, 2009 www.ncspfsig.org
Costs of ARTCDs in NC • Total costs of ARTCDs in NC = $4.7 BILLION per year • $1.9 billion in monetary costs • $3.3 billion in quality of life losses • Average cost per alcohol-related traffic crash death = $4.9 million • $1.6 million in monetary costs • $3.3 million in quality of life losses • Average cost per alcohol-related traffic crash non-fatal injury = $149,000 • $71,000 in monetary costs • $78,000 in quality of life losses Source: West Virginia Injury Control Research Center
Costs Per NC SPF SIG Community Sources: UNC Highway Safety Research Center (injury data); West Virginia Injury Control Research Center (cost data)
Cost Savings • The entire NC SPF SIG project is funded at $11.75 million dollars over five years. • At $4.9 million per fatal injury, if each NC SPF SIG community prevents ONE fatality during the entire project, it would save $88 million—more than 7 times the cost of the project. • At $149,000 per non-fatal injury, if each NC SPF SIG community prevents ONE non-fatal injury per year, it would more than offset the $100,000 that the community/state are spending on the project each year.
North Carolina SPF SIG: Evaluation NC SPF SIG Learning Community Durham, NC August 25 - 26, 2009 www.ncspfsig.org
Community-Level Evaluation Logic Model Substance- Related Consequences & Use (CO2) Intervening Variables/ Contributing Factors (CO3) Strategies (CP1) Inputs (CO1) Alcohol-related traffic crash deaths ---------- % of crashes that are AR; Rate of AR crashes per pop; # of AR fatal and non-fatal injuries; cost savings Community-Level Factors ---------- Examples: Perceptions of low risk of arrest, conviction, and/or penalties; Actual low risk of arrest, conviction, and/or penalties; Alcohol availability at community events; Alcohol availability in public locations Excessive drinking at private events Fidelity ---------- Extent to which milestones are reached and activities completed Strength, Dosage, and Reach ------------ People reached; frequency of activities; Organizational and Community Factors ------------ Org. capacity; Com. capacity; Com. readiness
Evaluation Alphabet Soup (CLI, PIF, ITF, and #@$!) • Community Level Instrument • Required by CSAP • Semi-annual • Very detailed at the strategy level; captures lots of information about activities and reach (what, who, how many, etc.) • Pre-Implementation Form • Required by NC evaluator (PIRE) • Once per strategy • Sets the stage for implementation and fidelity tracking • Implementation Tracking Form • Required by NC evaluator (PIRE) • Quarterly • Assesses fidelity to the strategy by tracking major milestones and activities for each core element • #@$! • Expresses evaluation frustrations • As often needed
Implementation Tracking Form • Milestones (up to 20, as identified in Pre-Implementation Form) • Examples • Domino Strategy – meet with local media, define messages and target groups, create calendar of when messages will be disseminated and to whom • Alcohol Server Training – Identify appropriate training, conduct TOT, identify all local targets for the training, conduct training and follow-up • Sobriety Checkpoints – meet with local law enforcement about their checkpoint activities, identify forms of media that can be used to support the checkpoints, select dates and places for news conferences, assist at the checkpoints, encourage media to write pre- and post- stories about checkpoints • Did you implement the strategy differently than planned? • Barriers during the quarter. • TA needs • Other issues for management team to consider to support the strategy
Tracking Successes • Neither the PIF nor the ITF feeds into the CLI—they serve different purposes. • #@$! So how can you track information more regularly to help complete the CLI, meet local documentation needs, and show small successes as they happen?