Download
1 / 1

E N D
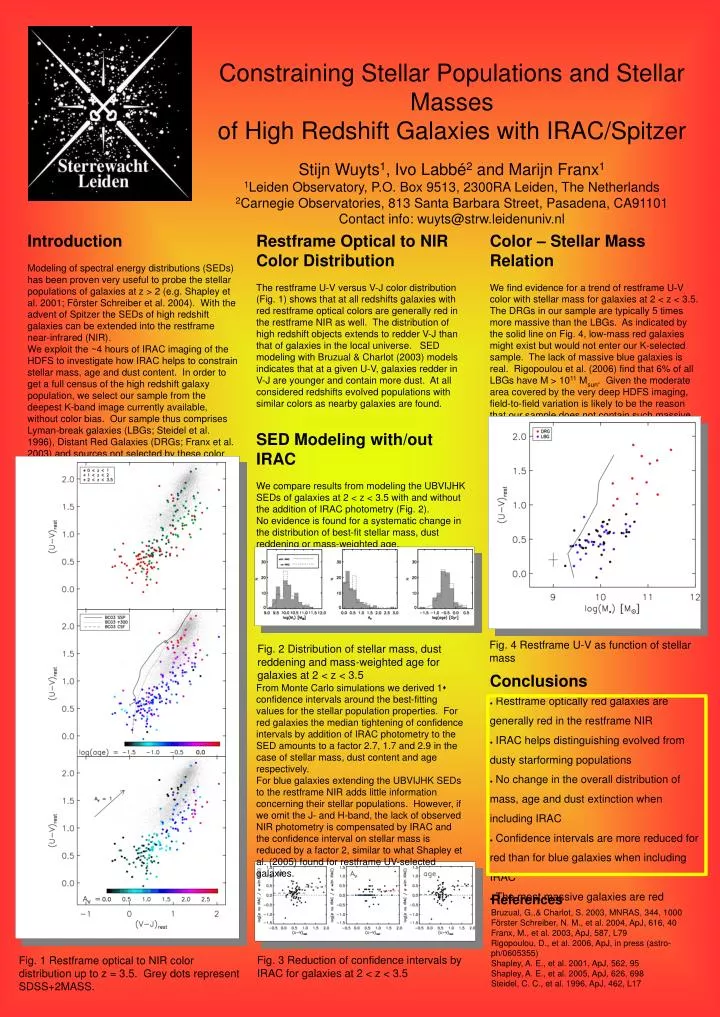
Constraining Stellar Populations and Stellar Massesof High Redshift Galaxies with IRAC/SpitzerStijn Wuyts1, Ivo Labbé2 and Marijn Franx11Leiden Observatory, P.O. Box 9513, 2300RA Leiden, The Netherlands2Carnegie Observatories, 813 Santa Barbara Street, Pasadena, CA91101Contact info: wuyts@strw.leidenuniv.nl SED Modeling with/out IRAC We compare results from modeling the UBVIJHK SEDs of galaxies at 2 < z < 3.5 with and without the addition of IRAC photometry (Fig. 2). No evidence is found for a systematic change in the distribution of best-fit stellar mass, dust reddening or mass-weighted age. Fig. 4 Restframe U-V as function of stellar mass Fig. 2 Distribution of stellar mass, dust reddening and mass-weighted age for galaxies at 2 < z < 3.5 From Monte Carlo simulations we derived 1s confidence intervals around the best-fitting values for the stellar population properties. For red galaxies the median tightening of confidence intervals by addition of IRAC photometry to the SED amounts to a factor 2.7, 1.7 and 2.9 in the case of stellar mass, dust content and age respectively. For blue galaxies extending the UBVIJHK SEDs to the restframe NIR adds little information concerning their stellar populations. However, if we omit the J- and H-band, the lack of observed NIR photometry is compensated by IRAC and the confidence interval on stellar mass is reduced by a factor 2, similar to what Shapley et al. (2005) found for restframe UV-selected galaxies. Fig. 3 Reduction of confidence intervals by IRAC for galaxies at 2 < z < 3.5 Introduction Modeling of spectral energy distributions (SEDs) has been proven very useful to probe the stellar populations of galaxies at z > 2 (e.g. Shapley et al. 2001; Förster Schreiber et al. 2004). With the advent of Spitzer the SEDs of high redshift galaxies can be extended into the restframe near-infrared (NIR). We exploit the ~4 hours of IRAC imaging of the HDFS to investigate how IRAC helps to constrain stellar mass, age and dust content. In order to get a full census of the high redshift galaxy population, we select our sample from the deepest K-band image currently available, without color bias. Our sample thus comprises Lyman-break galaxies (LBGs; Steidel et al. 1996), Distant Red Galaxies (DRGs; Franx et al. 2003) and sources not selected by these color criteria. Restframe Optical to NIR Color Distribution The restframe U-V versus V-J color distribution (Fig. 1) shows that at all redshifts galaxies with red restframe optical colors are generally red in the restframe NIR as well. The distribution of high redshift objects extends to redder V-J than that of galaxies in the local universe. SED modeling with Bruzual & Charlot (2003) models indicates that at a given U-V, galaxies redder in V-J are younger and contain more dust. At all considered redshifts evolved populations with similar colors as nearby galaxies are found. Color – Stellar Mass Relation We find evidence for a trend of restframe U-V color with stellar mass for galaxies at 2 < z < 3.5. The DRGs in our sample are typically 5 times more massive than the LBGs. As indicated by the solid line on Fig. 4, low-mass red galaxies might exist but would not enter our K-selected sample. The lack of massive blue galaxies is real. Rigopoulou et al. (2006) find that 6% of all LBGs have M > 1011 Msun. Given the moderate area covered by the very deep HDFS imaging, field-to-field variation is likely to be the reason that our sample does not contain such massive but rare LBGs. Conclusions • Restframe optically red galaxies are generally red in the restframe NIR • IRAC helps distinguishing evolved from dusty starforming populations • No change in the overall distribution of mass, age and dust extinction when including IRAC • Confidence intervals are more reduced for red than for blue galaxies when including IRAC • The most massive galaxies are red References Bruzual, G.,& Charlot, S. 2003, MNRAS, 344, 1000 Förster Schreiber, N. M., et al. 2004, ApJ, 616, 40 Franx, M., et al. 2003, ApJ, 587, L79 Rigopoulou, D., et al. 2006, ApJ, in press (astro-ph/0605355) Shapley, A. E., et al. 2001, ApJ, 562, 95 Shapley, A. E., et al. 2005, ApJ, 626, 698 Steidel, C. C., et al. 1996, ApJ, 462, L17 Fig. 1 Restframe optical to NIR color distribution up to z = 3.5. Grey dots represent SDSS+2MASS.