Download
1 / 19
190 likes | 312 Views
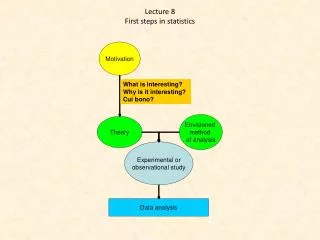
Lecture 8 First steps in statistics. How to perform a biological study. Defining the problem Identifying the state of art. Literature. Formulating specific hypothesis to be tested. Theory.

E N D
Lecture 8 First stepsinstatistics
How to perform a biological study Definingthe problem Identifyingthe state of art Literature Formulatingspecifichypothesis to be tested Theory Study design, poweranalysis, choosingtheanalyticalmethods, design of the data base, Planning Observations, experiments Meta analysis Data Statisticalanalysis, modelling Analysis Comparingwithcurrenttheory Interpretation Scientific writing,expertise Publication
Preparing the experimental or data collecting phase • Let’s look a bit closer to data collecting. Before you start any data collecting you have to have a clear vision of what you want to do with these data. Hence you have to answer some important questions • For what purpose do I collect data? • Did I read the relevant literature? • Have similar data already been collected by others? • Is the experimental or observational design appropriate for the statistical data analytical tests I want to apply? • Are the data representative? • How many data do I need for the statistical data analytical tests I want to apply? • Does the data structure fit into the hypothesis I want to test? • Can I compare my data and results with other work? • How large are the errors in measuring? Do theses errors prevent clear final results? • How large might the errors be for the data being still meaningful?
Scientific publications of any type are classically divided into 6 major parts • Title, affiliations and abstract In this part you give a short and meaningful title that may contain already an essential result. The abstract is a short text containing the major hypothesis and results. The abstract should make clear why a study has been undertaken • The introduction The introduction should shortly discuss the state of art and the theories the study is based on , describe the motivation for the present study, and explain the hypotheses to be tested. Do not review the literature extensively but discuss all of the relevant literature necessary to put the present paper in a broader context. Explain who might be interested in the study and why this study is worth reading! • Materials and methods A short description of the study area (if necessary), the experimental or observational techniques used for data collection, and the techniques of data analysis used. Indicate the limits of the techniques used. • Results This section should contain a description of the results of your study. Here the majority of tables and figures should be placed. Do not double data in tables and figures. • Discussion This part should be the longest part of the paper. Discuss your results in the light of current theories and scientific belief. Compare the results with the results of other comparable studies. Again discuss why your study has been undertaken and what is new. Discuss also possible problems with your data and misconceptions. Give hints for further work. • Acknowledgments Short acknowledgments, mentioning of people who contributed material but did not figure as co-authors. Mentioning of fund giving institutions • Literature
Thesource data base Neverusetheoriginal data base for calculations. Useonly a replicate. Take care of emptycells. In calculatedcellstakecare of impossiblevalues. Eachrowgets a single data record. Columnscontainvariables. Variablescan be of textormetrictype.
Cumulativefrequencydistribution Frequencydistribution
Discrete and continuousdistributions Probabilitygeneratingfunction (pgf) Continuousdistribution Discretedistribution Probability densityfunction(pdf) Statisticalorprobabilitydistributionsaddup to one.
Many statisticalmethodsrely on a comparison of observedfrequencydistributionswiththeoreticaldistributions. Deviationsfromtheory (fromexpectation) (so calledresiduals) aremeasures of statisticalsignificance. Df(x) Df(x) IftheDf(x) aretoolarge we acceptthehypothesisthatourobservationsdifferfromthetheoreticalexpectation. The problem instatisticalinferenceis to findtheappropriatetheoreticaldistributionthatcan be applied to our data.
Home work and literature • Refresh: • Arithmetic, geometric, harmonicmean • Variance, standard deviation standard error • Central moments • Third and fourth central moment • Mean and variance of power and exponentalfunctionstatisticaldistributions • Pseudocorrelation • Samplebias • Coefficient of variation • Representativesample • Prepare to thenextlecture: • Bernoulli distribution • Pascal distribution • Hypergeometricdistribution • Linear random number Literature: Mathe-online Łomnicki: Statystyka dla biologów.