Download
1 / 24
240 likes | 354 Views
Monitoring of Spent Nuclear Fuel Reprocessing Studies via UV-Visible Spectroscopy. Jamie L. Warburton Radiochemistry PhD Candidate University of Nevada, Las Vegas Harry Reid Center for Environmental Studies. Outline. Introduction ANL experiments Experimental Setup Results UNLV

E N D
Monitoring of Spent Nuclear Fuel Reprocessing Studies via UV-Visible Spectroscopy Jamie L. Warburton Radiochemistry PhD Candidate University of Nevada, Las Vegas Harry Reid Center for Environmental Studies
Outline • Introduction • ANL experiments • Experimental Setup • Results • UNLV • Experimental Setup • Results • Conclusions
Introduction • Process monitoring can improve safeguards in spent nuclear fuel reprocessing • Several parameters can be monitored • Mass, temperature, flow rate, pH, concentration • UV-Vis is an effective technique for concentration monitoring • Portable • On-line capability • Very fast spectral acquisition • Rapid analysis possible to confirm process chemistry and for materials accountability • Peak to peak ratio measurements • Significant changes in absorbance
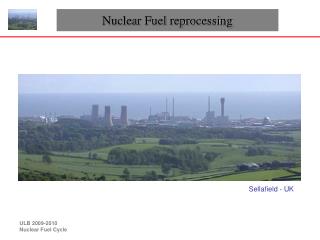
Background • Argonne has conducted bench scale demos of UREX+ flowsheets • Experiments used a 24-stage bank of 2 cm contactors • Process variables include • Concentrations • Feed • Solvent • Scrub • Strip • Flow rates • Feed • Solvent • Scrub • Strip • Temperatures • Extraction, scrub, strip Fuel Derived Feed Aqueous HNO3 Solvent TBP in dodecane Strip Aqueous HNO3 Scrub Aqueous HNO3 Extraction Section Scrub Section Strip Section Raffinate Aqueous HNO3 Pu, FP Product Aqueous HNO3 U, Tc Spent Solvent
Centrifugal Countercurrent Contactors • In the UREX process, UO22+ is extracted from the feed into the solvent • Next, the scrub section scrubs the loaded solvent, now containing UO22+, of any fission products that may have co-extracted with the UO22+ • The dilute HNO3 strip solution extracts the UO22+ species from the loaded solvent, exiting the scrub section Scrub Scrub Feed Spent solvent Strip Raffinate Solvent Product
Aqueous Fresh Feed Solvent Aqueous Product Loaded Solvent Centrifugal Countercurrent Contactors • Housed as one • Fast • Efficient Spinning Rotor with Indicator Separation Zone Mixing Zone
Fiber optic dip probe (ANL) • Range of probe 0.005-0.566 M U conservatively • Resolution of system found to be 0.002 ± 0.0001 M U • Aqueous 0.09, 0.10 & 0.11 M Nd(NO3)3 used in qualitative time response study • Acquisition time of 300 μs • Instantaneous spectral changes seen when probe put alternately in each solution 7
20-stage 2-cm unit Experimental Setup • Probe measuring product stream via Swagelok flow-through cell • OmniDriver integrated into LabVIEW controller • Spectral acquisition time of 250 microseconds • Cold feed used to achieve steady-state in contactors • Hot run after steady state ~3.5 hours • 1.002 ± 0.001 M HNO3, 28.1 ± 1.41 g/L U feed
Results • Characteristic peaks evident at 403, 414, & 426 nm • Uranyl grows into product stream due to 20-stage contactors and time needed to achieve steady-state • Reducing the strip solution flow rate causes the UO22+ to be incompletely stripped from the loaded solvent and results in a higher concentration in the product stream Graph illustrating the growth of the UO22+ in the product stream exiting stage 17 over time1 1 Image courtesy of J.F. Krebs, ANL
Summary • Fiber optic probe setup is successful in monitoring product conditions in simulated UREX run • Varying flow rate does not affect spectral acquisition, but does affect product concentration • UV-Vis monitoring used in conjunction with flow rate meters to identify source of absorbance changes • Intended vs. unintended flow rate alterations • Material diversion • Acquisition time of 250 ms • Online automated monitoring of peaks as well as peak to peak comparison is needed – user monitoring is too slow • Flow rates result in slugs of solution in product stream 10
Flow-thru Cuvettes (UNLV) • Hellma flow-through cuvettes instead of fiber optic dip probe • Utilizing robust UV-Vis while peristaltic pump provides sample flow • Sample “stock” is outside UV-Vis and can be changed during absorbance measurements • Various pathlengths available (1 cm, 0.5 cm, 0.1 cm) • Disassemble setup to change pathlength • Flow rates • Previously (ANL) looking at 5-40 mL/min • Peristaltic pump’s (UNLV) range is ~0.5-4 mL/min • Industrial scale will be ~ L/min • Slight variations due to tightness of clamps and tubing size 11
Experimental Setup Flow-through cuvette connected to peristaltic pump Cuvette placed inside UV-Visible spectrometer
A, B, D Pathlength Normalized • Allows for direct comparison across varying pathlength samples2 • Calculation of [U] • A ~ 0.008 M (0.01 M) • B ~ 0.10 M (0.12 M) • D ~ 0.22 M (0.26 M) [2] Theoretical Basis of Bouguer-Beer Law of Radiation Absorption, F.C. Strong, 1952.
E, G, H Pathlength normalized • Calculation of [U] • E ~ 0.57 M (0.63 M) • G ~ 0.96 M (1.01 M) • H ~ 1.28 M (1.26 M)
Summary • Loss of peak resolution evident at 6 M HNO3 across uranyl concentrations • Peak ratio changes throughout uranyl concentrations for [H+] ≥ 3 M • At highest uranyl (1.26 M) shouldering in spectra across [H+] range • Calculation assuming ε=10 M-1cm-1 provides method and experimental check
Summary • No change across • 0.01 M & 0.1 M [H+] • 0.5 M & 1 M [H+] • Trends in peak ratios remain similar • Rapid changes seen at 3 M & 6 M [H+] • Complete loss of peak resolution • Significant trend alterations in peak ratios No distinct peaks at 6 M [H+]
Conclusions • Alleviated slug flow obstacle seen in fiber optic dip probe via cuvette flow-through cell • At high [HNO3] (or high [NO3-]) and high [UO22+] • Still see loss of peak definition as expected3 • Calculations of ε confirm [HNO3] and [U] dependence • UV-Vis spectroscopy can be used effectively in process monitoring to demonstrate a more proliferation-resistant fuel reprocessing plant [3] The Simultaneous Analysis of Uranium and Nitrate, D.T. Bostick et al, 1978. 22
Titration cell setup with flow-through cuvettes Can precisely alter [H+], [NO3-], [UO22+] Single-user interface Evaluate sensitivity to rate of change of acid and nitrate Identify change from UREX to PUREX Confidence level? 8 kg Pu or 25 kg HEU Future Work 23
Acknowledgements • Dr. Kenneth Ronald Czerwinski • Dr. Patricia Paviet-Hartmann • Dr. Gary Steven Cerefice • Nick Smith • Amber Wright • Dr. John F. Krebs, ANL • This work was performed under the Nuclear Forensics Graduate Fellowship Program which is sponsored by the U.S. Department of Homeland Security’s Domestic Nuclear Detection Office and the U.S. Department of Defense’s Domestic Threat Reduction Agency 24