Download
1 / 18
180 likes | 348 Views
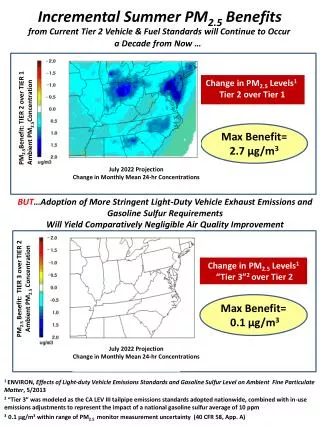
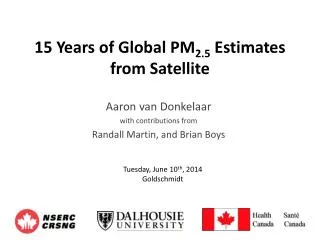
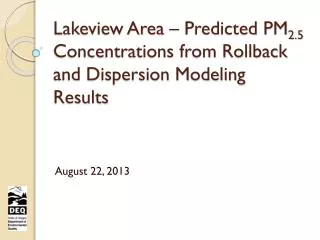
Estimating Surface PM 2.5 Concentrations using Satellite AOD. Sundar A. Christopher The University of Alabama in Huntsville sundar@nsstc.uah.edu VIIRS Aerosol Science and Operational Users Workshop November 21-22, 2013.

E N D
Estimating Surface PM2.5 Concentrations using Satellite AOD Sundar A. Christopher The University of Alabama in Huntsville sundar@nsstc.uah.edu VIIRS Aerosol Science and Operational Users Workshop November 21-22, 2013 Hoff, R., S.A. Christopher, Remote Sensing of Particulate Matter Air Pollution from Space : Have we reached the promised land?, J. Air & Waste Management Association, 59:642-675, 2009.
What is PM2.5? • Particles < 2.5µm in diameter – ‘Fine Particles’ • All types of combustion – examples : motor vehicles, power plants, forest/agricultural burning,
Why study PM2.5? 1996-1998 Fine Mass Premature Mortality Risk Huntsville Alabama Health studies show link between increased PM2.5 mass and premature mortality. 10 µgm-3 increase in PM was associated with 8% to 18% increases in mortality risk [Pope et al., 2003]. Paciorek/ Hu/Al-Hamdan
Index Values Category Cautionary Statements PM2.5 (ug/m3) PM10 (ug/m3) 0-50 Good None 0-15.4 0-54 51-100 Moderate Unusually sensitive people should consider reducing prolonged or heavy exertion 15.5-40.4 55-154 101-150 Unhealthy for Sensitive Groups Sensitive groups should reduce prolonged or heavy exertion 40.5-65.4 155-254 151-200 Unhealthy Sensitive groups should avoid prolonged or heavy exertion; everyone else should reduce prolonged or heavy exertion 65.5-150.4 255-354 201-300 Very Unhealthy Sensitive groups should avoid all physical activity outdoors; everyone else should avoid prolonged or heavy exertion 150.5-250.4 355-424 U.S. Air Quality Guidelines NAAQS: 35 mg/m3 (24 h), 15 mg/m3 (annual)
WHO - Guidelines NAAQS: 35 mg/m3 (24 h), 15 mg/m3 (annual)
1500 0-3 20-30 3-8 1-5 5-10 1-5 4-9 Surface PM2.5 mass monitors Number of Ground measurements are sparse and inadequate for monitoring global PM2.5 mass concentrations – especially outside the United States
Satellite Remote Sensing SNOW CLOUDS SMOKE GLINT HAZE GLINT Engel-Cox Satellites remote sensing is the only viable method for monitoring global particulate matter air pollution
VIIRS Example Aerosol Birmingham Alabama
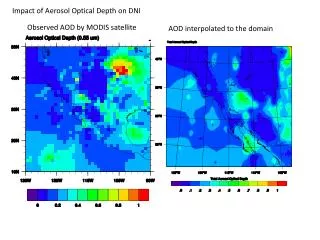
But what do satellites measure? • Need surface PM2.5 • Have column AOD • AOD is related to PM2.5 but need ancillary information Satellite measured radiances are converted to columnar Aerosol Optical Thickness/Depth
Satellite and ground-based data Both Level 1 RGB imagery and level 2 aerosol product information is useful Christopher, S.A., P. Gupta, U. Nair, T.A. Jones, S. Kondragunta, Y. Wu, J. Hand, X. Zhang, Satellite Remote Sensing and Mesoscale Modeling of the 2007 Florida/Georgia Fires, IEEE Journal of Selected Topics in Applied Earth Observations and Remote Sensing (JSTARS-2009-00020), 26, 1-13, 2009
0.0 0.2 0.4 0.6 0.8 1.0 0 10 20 30 40 50 60 70 0 15.5 40.5 65.5 150.5 Aerosol Optical Depth Cloud Optical Thickness PM2.5 (ug/m3) Sept 9 Sept 10 No EPA sites MODIS fills in Sept 11 Sept 12
Wang and Christopher, 2003 Hourly, R= 0.7;Daily, R >0.9 Correlating PM2.5 and AOD For the easy (relatively) cases if there is a PM-AOD relationship (linear in this case) use AOD to estimate PM2.5 Wang, J., and S. A. Christopher, Intercomparison between satellite-derived aerosol optical thickness and PM2.5 mass: Implications for air quality studies, Geophys. Res. Lett., 30(21), 2095, doi:10.1029/2003GL018174, 2003
Creating AQI maps • Every pixel that is not cloud covered has an AQI value
Uncertainties PM2.5 /AOD varies across studies due to different assumptions. Uncertainty Linear Correlation Coefficient Even though clouds prevent AOD retrievals ~50% of the time, difference between ALL PM2.5 from ground and PM2.5 during time of satellite overpass is < 2ugm-3 for seasonal and yearly averages (Christopher and Gupta, 2009).
Beyond the linear correlation Van Donkelaar, et al 2006 Liu et al (2005) Observed PM2.5 Predicted PM2.5 Aircraft studies also show that normalizing AOD with PBL height significantly improves AOD-PM2.5 relationship (Al-Saadi) PBL, RH are necessary to estimate PM2.5 from columnar satellite retrievals. Correlations increase from 0.3 to 0.7.
Progress PM2.5 Estimation from Satellite Observations (MODIS, MISR, GOES, POLDER) Two variate methods Neural Networks Multi-variate methods MVM PM2.5=α+ α1*AOT+ α2*TMP+ α3*HPBL+ α3*WS+ α4*RH Y=mX + c PM2.5 AOT GlobalEstimates Few POLDER TWO? THREE Dozen + Epidemiology MODIS MISR GOES Lidar SeaWifs 1984 2000 2003 2009 2002 2004 2005 2006 2007 2008 2013 Critical Review Fraser& Kaufman 1st paper BAMS Review Aqua Terra Global VIIRS
VIIRS Examples June 26, 2013 June 23, 2013 June 29, 2013
Summary • Satellite data continue to be useful to monitor air pollution • With ancillary data sets, satellite AOD can be used to estimate PM2.5 concentrations across the earth. Especially useful where no ground monitors are available • Awareness in other communities (e.g. epidemiology) continues to increase