Download
1 / 28
280 likes | 426 Views
Equilibrium Constant Lab. Calculations Using Word Writing in Science Format. Calculations. You will need to “lead” the reader through ONE of your sample data. Important to be thorough as each step should be explained.

E N D
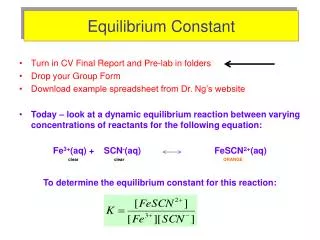
Equilibrium Constant Lab • Calculations • Using Word • Writing in Science • Format
Calculations • You will need to “lead” the reader through ONE of your sample data. • Important to be thorough as each step should be explained. • When this is done you can then simply state that all other trials were calculated in a similar fashion using the values for that specific trial.
What we did… • We used our absorbance and best-fit line to generate “x”. • y = 1500x + 0.001 • Absorbance = 0.115 (= “y”) • 0.115 = 1500x + 0.001 • subtract 0.001 from both sides • 0.114 = 1500x • divide both sides by 1500 • x = 7.6 E-5
What we did… • This is the value of “x” in the ICE table. #2 Fe+3 + SCN- FeSCN+2 I = 0.001 0.0004 0 C = -1x -1x +1x E = 0.001-x 0.0004-x x E = 9.24E-4 3.24E-4 7.6E-5
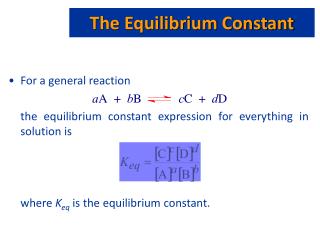
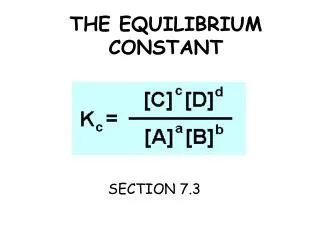
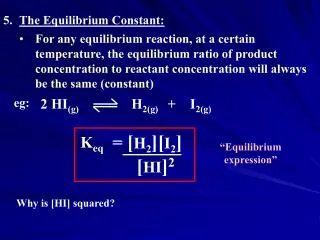
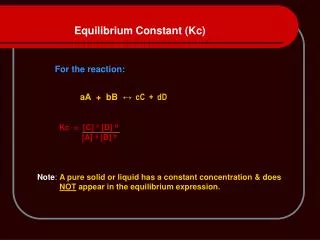
What we did… • The equilibrium expression is: • And calculating this by using the values from the previous page yields: Kc = 254.
Calculating an Average • Use “best” data to produce an average. • Points excluded might need to be explained in paper. • Possible reasons? • Calculate a standard deviation or %RAD (in lab book).
Using Word • There are many enhancements that you can use to make your paper look “nice.” • Subscript and superscripts keys can be added to the toolbar or use keyboard shortcut. • Go to Customize under the Tools page • Select the Commands tab • Select Format from the list of Categories • Scroll down the list to the subscript and superscript commands and then drag to any toolbar
Using Word • Shortcuts for these are: • subscript = CTRL+= keys • superscript = CTRL+SHIFT+= keys • return to normal font = CTRL+SPACE bar • Equation editor can be used to make equations or expressions • found under Insert then select Object • MS Equation Editor 3.0
Using Word • Data Tables can be added by using the Table menu • Can also import table from an Excel file • Should label all tables and make sure they are located on a single page.
Writing in Science • There are many differences in writing for science courses versus an English class (or other). • Audience • Writing in science assumes that your audience (reader) has a technical background in that discipline • Write as if your reader is a 4th year Chemistry major.
Writing in Science • Structure • A formalized structure informs and defines the paper. • Place sub-headings at the beginning of EACH section. • Title, Abstract, Introduction, Procedure, Results, and Conclusion.
Writing in Science • First or Third Person? • First person (I, we, etc.) used to be forbidden words. • Use of third person, passive voice was the choice of all science writing. • I will require that you use third person for this lab report. • Avoid contractions
Writing in Science • Example • I heated the test tube over the burner for several minutes. • The test tube was heated over the burner for several minutes. • I added 50. milliliters of distilled water to the flask to dissolve the solid. • A total of 50. milliliters of distilled water was added to the flask to dissolve the solid.
Writing in Science • Diction should be dense. • Try to combine sentences and wording to convey as much as possible in as few words as possible. • However, be careful that you do not remove needed information. • This is most important in the Procedure section.
Writing in Science • The metal pieces were placed into several large tubes, which were placed into a water bath. A Bunsen burner was then used to heat the water bath to the boiling point. The metal pieces were heated for a period of five minutes.
Writing in Science • Using several large test tubes and a hot water bath, metal pieces were heated at the boiling point of water for five minutes.
Format • Sections are: • Title and Abstract • Introduction • Procedure • Results • Conclusion • Appendix
Title and Abstract • Title should convey specifically what the lab was to accomplish. • “The Determination of a Rate Law and Activation Energy for the Reaction Between Crystal Violet and Sodium Hydroxide.” • “Determining the Quantity of Vitamin C in an Over-the-counter Tablet.”
Title and Abstract • The Abstract should describe exactly what the experiment set out to prove and the actual results. • The Abstract is a short synopsis of the paper. • The abstract should not be longer than 100 words – ideally around 50 words or so.
Title and Abstract • The purpose of this experiment was to first determine the rate law of the reaction between Crystal Violet and Sodium Hydroxide using a spectrophotometer. The experiment determined that the reaction is first order in both reactants. Then, the temperature was varied in order to determine the activation energy. An average Ea for the data was 55 kJ/mol ± 5 kJ/mol.
Introduction • The "Introduction" of a laboratory report identifies the experiment to be undertaken, the objectives of the experiment, the importance of the experiment, and overall background for understanding the experiment. • The objectives of the experiment are important to state because these objectives are usually analyzed in the conclusion to determine whether the experiment succeeded. • The background often includes theoretical predictions for what the results should be.
Introduction • This report discusses an experiment to study the relationship of temperature and pressure of an ideal gas (air) that was heated in a closed container. Because the ideal gas was in a closed container, its volume remained constant. The objective of the experiment is to test whether the ideal equation of state holds. In the equation, pV = nRT, where p is the pressure the gas, V is the volume, n is the moles, R is a constant, and T is temperature. This report presents the procedures for the experiment, the experiment's results, and an analysis of those results.
Procedure • This section describes exactly how the experiment was performed. • It should contain enough detail such that any chemist could re-create your work. • Remember that any chemist would be familiar with pipetting, using instruments, etc. • Thus, be careful not to get too wordy in the procedures.
Procedure In this experiment, air (an ideal gas) was heated in a pressure vessel with a volume of 1 liter. Attached to this pressure vessel was a pressure transducer and thermocouple to measure the pressure and the temperature, respectively, of the air inside the vessel. Both of these transducers produced voltage signals (in Volts) that were calibrated to the pressure (kPa) and temperature (K) of the air (the atmospheric pressure for where the experiment occurred is assumed to be 13.6 psi). In addition, the theoretical temperature (K) of air was calculated as a function of the measured pressured values (kPa).
Results / Data • The heart of a laboratory report is the presentation of the results and the discussion of those results. • Much here depends upon your experiment and the purpose of your laboratory report. • In discussing the results, you should not only analyze the results, but also discuss the implications of those results. • For calculations, need to “walk” the reader through the steps necessary to get the answer. • One important way to present numerical results is to show them in graphs.
Conclusion • Whereas the “Results” section has discussed the results individually, the “Conclusion” section discusses the results in the context of the entire experiment. • Usually, the objectives mentioned in the “Introduction” are examined to determine whether the experiment succeeded. • For data points that are excluded, a proposed reason (or reasons) are discussed. • Can also discuss further experimentation or improvements for the next experimenters.
Appendix • Optional stuff can go here. • Can include calculations, graphs, and data.
Individual or Small Group • Option A = Write up and submit as an individual report. • Option B = Write up and submit as a group of two. • Can use Google Docs (instructions on my web page). • Include statement at end for both to sign – “I certify that I have shared in the writing of this lab report.”