Download
1 / 12
120 likes | 125 Views
Visual Debugging Tools for Concurrent Models of Computation. Elaine Cheong 15 May 2002 EE290N: Advanced Topics in System Theory. Why Debugging?. Software is complex. Concurrent software is even more complex. What if it the implementation does not behave as expected? Bugs, bugs, bugs….

E N D
Visual Debugging Tools for Concurrent Models of Computation Elaine Cheong 15 May 2002 EE290N: Advanced Topics in System Theory
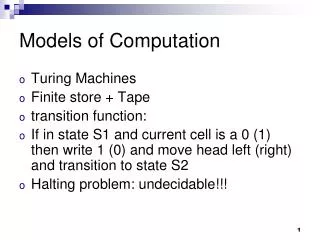
Why Debugging? • Software is complex. • Concurrent software is even more complex. • What if it the implementation does not behave as expected? • Bugs, bugs, bugs…
Outline • Types of Debugging • Debugging in Ptolemy II • Future Work • Conclusion
Types of Debugging • Event-based • State-based
Event-Based Debugging • What is an event? • Event order observation • Event order tracking • Event abstraction • Filtering • Clustering • Interpretation • Process abstraction
State-Based Debugging • Source-level debugging • Consistent cuts • Debugging • Breakpoints • Stepping • Global step • Step over • Step in • Global state predicates
Probe Effects • What is a probe? • Code (or hardware) that generates debugging event records. • Hook that provides access to the state of a process at runtime. • Can mask or introduce new bugs. • Permanent instrumentation for system monitoring.
Ptolemy II • A domain is an implementation of a model of computation. • Ptolemy II domains are actor-oriented and concurrent, but are not threads. • Visual interface.
Debugging in Ptolemy II • Demo!
Conclusions • Both event- and state-based debugging is possible in Ptolemy II. • Future Work • Additional domains • Additional state information • Predicates for breakpoints using the expression language. • Generate trace diagrams.
References • Peter C. Bates. Debugging Heterogeneous Distributed Systems Using Event-Based Models of Behavior. ACM Transactions on Computer Systems, Vol. 13, No. 1, Feb 1995, pg 1-31. • Kenneth J. Hines. Coordination-centric Debugging for Heterogeneous Distributed Embedded Systems. Ph.D. Dissertation. 2000. • S. I. Hyder et al. A Unified Model for Concurrent Debugging. International Conference on Parallel Processing, 1993. • Ronald A. Olsson et al. A Dataflow Approach to Event-Based Debugging. Software Practice and Experience, Vol. 21, No. 2, 1991, pg 209-230. • M. Krish Ponamgi. Debugging Multi-Threaded Programs with MpD. IEEE Software, pg 37-43, May 1991. • Richard M. Stallman. GDB Manual: The Gnu source-level debugger. Free Software Foundation, 1987.