Download
1 / 10
100 likes | 111 Views
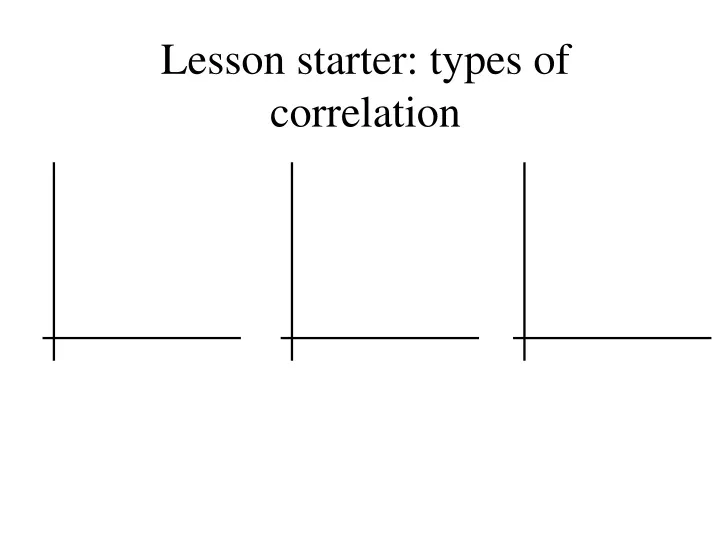
Lesson starter: types of correlation. Scatter graphs Thursday, 02 January 2020. A scatter graph is used to try to find a relationship between two variables (things). Here is an example of how the information about AGE and AMOUNT OF MONEY SPENT AT THE WEEKEND is put onto a scatter graph.

E N D
Scatter graphs Thursday, 02 January 2020 A scatter graph is used to try to find a relationship between two variables (things) Here is an example of how the information about AGE and AMOUNT OF MONEY SPENT AT THE WEEKEND is put onto a scatter graph. People were asked: What is your age? How much money did you spend this weekend? Their answers were recorded in a table like this:
I’m 16 and I spent £10 I’m 18and I spent £25
I’m 17 and I spent £22 I’m 18 and I spent £10 I’m 15 and I spent £8
I’m 17and I spent £15 I’m 19and I spent £30
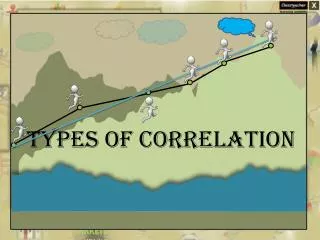
This line is called the line of best fit. If it goes up in this direction, it has a positive correlation.
Pupil A B C D E F G H I J K L M Shoe S. 2 2 3 4 5 7 6 5 6 7 4 3 2 Height 1.3 1.5 1.4 1.4 1.5 1.8 1.7 1.6 1.6 2 1.3 1.5 1.3 • Plot these points on a scatter diagram. • What type of correlation does the scatter graph show between shoe size and height? • What can you usually say about a the connection between shoe size and height?
Pupil A B C D E F G H I J K L Hours Rev. 45 67 97 34 5 78 34 12 49 76 89 90 No. GCSE 4 6 9 1 0 5 2 1 5 8 9 10 Plot these points on a scatter graph to show the connection between revision and number of GCSE passes. • Draw a line of best fit onto the scatter graph. • Use this line to estimate how many hours are needed for 7 GCSE passes.