Download
1 / 121
1.23k likes | 1.44k Views
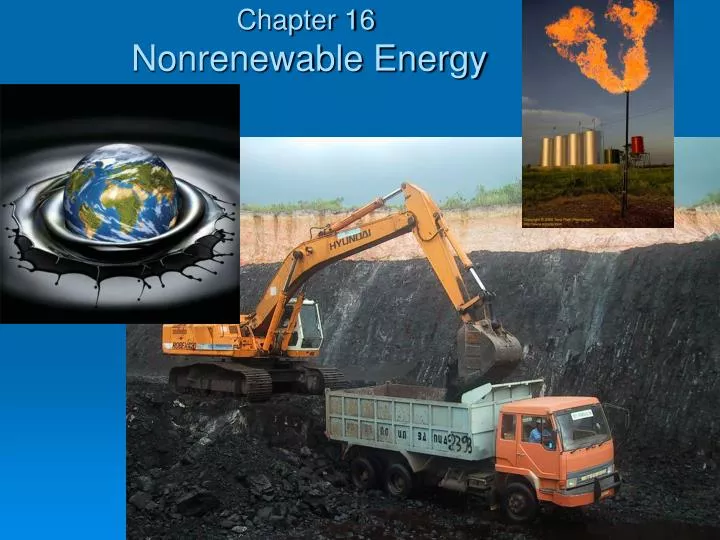
Chapter 16 Nonrenewable Energy. Chapter Overview Questions. What are the advantages and disadvantages of conventional oil and nonconventional heavy oils ? What are the advantages and disadvantages of natural gas ?

E N D
Chapter Overview Questions • What are the advantages and disadvantages of conventional oil and nonconventional heavy oils? • What are the advantages and disadvantages of natural gas? • What are the advantages and disadvantages of coal and the conversion of coal to gaseous and liquid fuels?
Chapter Overview Questions (cont’d) • What are the advantages and disadvantages of • conventional nuclear fission • breeder nuclear fission • nuclear fusion (note: there is no such word as “nucular”)
The Thunder Horse production platform is the largest moored semi-submersibleoil platform in the world, located in 1,920 metres (6,300 ft) of water in the Mississippi Canyon Block 778/822, about 150 miles (241 km) southeast of New Orleans. Construction costs were around five billion USD,[7] and the platform is expected to operate for 25 years.
July 12, 2005--Thunder Horse, a semi-submersible platform owned by BP, was found listing after the crew returned. The rig was evacuated for Hurricane Dennis.
Core Case Study: How Long Will the Oil Party Last? • Saudi Arabia could supply the world with oil for about 10 years. • The Alaska’s North Slope could meet the world oil demand for 6 months (U.S. 3 years). • Alaska’s Arctic National Wildlife Refuge would meet the world demand for 1-5 months (U.S. 7-25 months).
Core Case Study: How Long Will the Oil Party Last? • “Contrary to popular belief, the world is not about to run out of oil in the near future.” • “Geologists predict that known and projected global reserves of conventional oil will be 80% depleted sometime between 2050 and 2100” Miller (2009), p.370 • Peak oil will occur significantly before 80% depletion.
Core Case Study: How Long Will the Oil Party Last? • In 2008, the IEA predicted a plateau by 2020 and a peak by 2030. The report called for a "global energy revolution" to prepare mitigations by 2020 and avoid "more difficult days" and large wealth transfers from OECD nations to oil producing nations.[78] This estimate was changed in 2009 to predict a peak by 2020, with severe supply-growth constraints beginning in 2010 (stemming from "patently unsustainable" energy use and a lack of production investment) leading to rapidly increasing oil prices and an "oil crunch" before the peak.[122] • It has been noted that even a "plateau oil" scenario may cause socio-political disruption through extreme petroleum price instability.
How Long Will the Oil Party Last?The Hirsch Report • In 2005, the United States Department of Energy published a report titled Peaking of World Oil Production: Impacts, Mitigation, & Risk Management.[136] Known as the Hirsch report, it stated, "The peaking of world oil production presents the U.S. and the world with an unprecedented risk management problem. As peaking is approached, liquid fuel prices and price volatility will increase dramatically, and, without timely mitigation, the economic, social, and political costs will be unprecedented. Viable mitigation options exist on both the supply and demand sides, but to have substantial impact, they must be initiated more than a decade in advance of peaking."
How Long Will the Oil Party Last?The Hirsch Report • In 2008, the IEA predicted a plateau by 2020 and a peak by 2030. The report called for a "global energy revolution" to prepare mitigations by 2020 and avoid "more difficult days" and large wealth transfers from OECD nations to oil producing nations.[78] This estimate was changed in 2009 to predict a peak by 2020, with severe supply-growth constraints beginning in 2010 (stemming from "patently unsustainable" energy use and a lack of production investment) leading to rapidly increasing oil prices and an "oil crunch" before the peak.[122] • It has been noted that even a "plateau oil" scenario may cause socio-political disruption through extreme petroleum price instability.
How Long Will the Oil Party Last?The Hirsch Report • World oil peaking is going to happen - some forecasters predict within a decade, others later. • Oil peaking could cost economies dearly - particularly that of the U.S. • Oil peaking presents a unique challenge - previous transitions were gradual and evolutionary; oil peaking will be abrupt and revolutionary. • The real problem is liquid fuels for transportation - motor vehicles, aircraft, trains, and ships have no ready alternative. • Mitigation efforts will require substantial time - an intense effort over decades.
How Long Will the Oil Party Last?The Hirsch Report • Both supply and demand will require attention - higher efficiency can reduce demand, but large amounts of substitute fuels must be produced. • It is a matter of risk management - early mitigation will be less damaging than delayed mitigation. • Government intervention will be required - otherwise the economic and social implications would be chaotic. • Economic upheaval is not inevitable - without mitigation, peaking will cause major upheaval, but given enough lead-time, the problems are soluble. • More information is needed - effective action requires better understanding of a number of issues.
Core Case Study: How Long Will the Oil Party Last? We have three options: Look for more oil. Use or waste less oil. Use something else. Thunder Horse floating oil platform, Gulf of Mexico http://en.wikipedia.org/wiki/Thunder_Horse
TYPES OF ENERGY RESOURCES • Total Heat Energy! About 99% of the energy we use for heat comes from the sun and the other 1% comes mostly from burning fossil fuels. • Solar energy indirectly supportswind power, hydropower, and biomass. • About 76% of global commercial energy use comes from nonrenewable fossil fuels (oil, natural gas, and coal) with the remainder coming from renewable sources.
Nuclear power 6% Geothermal, solar, wind 2.5% Nuclear power 8% Geothermal, solar, wind 1% Hydropower 4.5% Hydropower, 3% Natural gas 23% Natural gas 21% RENEWABLE 18% Biomass 11% Coal 23% Biomass 3% RENEWABLE 7% Coal 22% Oil 39% Oil 33% NONRENEWABLE 82% NONRENEWABLE 93% World United States Fig. 15-3, p. 373
Nonrenewable energy resources and geothermal energy in the earth’s crust.
OIL & NATURAL GAS COAL GEOTHERMAL ENERGY Floating oil drilling platform Oil storage Contour strip mining Oil drilling platform on legs Hot water storage Oil well Gas well Geothermal power plant Pipeline Mined coal Valves Area strip mining Pipeline Pump Drilling tower Underground coal mine Impervious rock Oil Natural gas Water Water is heated and brought up as dry steam or wet steam Water Water penetrates down through the rock Coal seam Hot rock Magma Fig. 16-2, p. 357
NET ENERGY • Net energy is the amount of high-quality usable energy available from a resource after subtracting the energy used to make it available. Gross Energy – Energy Used = Net Energy • Net energyratio is the ratio of “net energy” to “energy used”. Net Energy/Energy Used = Net Energy Ratio Net Energy Ratio <1 = Energy Loss!
Space Heating Passive solar 5.8 Natural gas 4.9 Oil 4.5 Active solar 1.9 Coal gasification Net Energy Ratios for Various Energy Systems over Their Estimated Lifetimes 1.5 Electric resistance heating (coal-fired plant) 0.4 Electric resistance heating (natural-gas-fired plant) 0.4 Electric resistance heating (nuclear plant) 0.3 High-Temperature Industrial Heat Surface-mined coal 28.2 Underground-mined coal 25.8 Natural gas 4.9 Oil 4.7 Coal gasification 1.5 Direct solar (highly concentrated by mirrors, heliostats, or other devices) 0.9 Transportation Natural gas 4.9 Gasoline (refined crude oil) 4.1 Biofuel (ethyl alcohol) 1.9 1.4 Coal liquefaction Oil shale 1.2 Fig. 16-4, p. 358
SPACE HEATING Passive solar 5.8 Natural gas 4.9 Oil 4.5 Active solar 1.9 Coal gasification 1.5 Net Energy Ratios Electric resistance heating (coal-fired plant) 0.4 Electric resistance heating (natural-gas-fired plant) 0.4 Electric resistance heating (nuclear plant) 0.3 Fig. 15-A (1), p. 374
High-Temperature Industrial Heat 28.2 Surface-mined coal 25.8 Underground-mined coal Natural gas 4.9 Oil 4.7 Coal gasification 1.5 0.9 Direct solar (concentrated) Net Energy Ratios Fig. 15-A (2), p. 374
TRANSPORTATION Ethanol from sugarcane residue 8.0 Ethanol from switchgrass 5.4 Natural gas 4.9 Gasoline (refined crude oil) 4.1 Coal liquefaction 1.4 Net Energy Ratios Oil shale 1.2 Ethanol from corn 1.1 (but can reach 1.5) Fig. 15-A (3), p. 374
OIL • Crude oil (petroleum) is a thick liquid containing hydrocarbons that we extract from underground deposits and separate into products such as gasoline, heating oil and asphalt.
Crude Oil(Petroleum) • Only 35-50% can be economically recovered from a deposit. • As prices rise, about 10-25% more can be recovered from expensive secondary extraction techniques (flushing well with steam or water) • This lowers the net energy yield. • We may be able to increase economic recovery to 75% (Univ. of Alberta scientists working on using microorganisms to increase flow of heavy oil)
Oil Refinery Fig. 15-4b, p. 375
Refining crude oil: • Based on boiling points, components are removed at various layers in a giant distillation column. • The most volatile components with the lowest boiling points are removed at the top. Next
Gases Gasoline Aviation fuel Heating oil Diesel oil Naptha Heated crude oil Grease and wax Furnace Asphalt Fig. 16-5, p. 359
Global Oil • Thirteen OPEC (Organization of Petroleum Exporting Countries) countries have at least 60% of the world’s proven oil reserves and most of the world’s unproven reserves. • After global production peaks and begins a slow decline, oil prices will rise and could threaten the economies of countries that have not shifted to new energy alternatives. • Geologists expect global peak production to occur in 5-38 years, depending on the assumptions built in to their computer models.
Case Study: U.S. Oil Supplies • The U.S. – the world’s largest oil user – has only 2.4% of the world’s proven oil reserves. • U.S oil production peaked in 1974 (halfway production point). • The US imports about 60% of our oil, 70% by 2020 • About 60% of these U.S oil imports goes through refineries in hurricane-prone regions of the Gulf Coast.
Alaska’s North Slope & Arctic National Wildlife Refuge (ANWR)
Alaska’s North Slope & Arctic National Wildlife Refuge (ANWR)
Alaska’s North Slope & Arctic National Wildlife Refuge (ANWR)
Alaska’s North Slope & Arctic National Wildlife Refuge (ANWR)
Drill in Alaska? • Alaska’s North Slope oil reserves would meet current global demand for 6 months or US demand for 3 years. • Alaska’s Arctic National Wildlife Refuge (ANWR) oil reserved would meet global demand for 1-5 months or US demand for 7-24 months.
14 13 12 11 Projected U.S. oil consumption 10 9 Barrels of oil per year (billions) 8 7 6 5 4 3 Arctic refuge oil output over 50 years 2 1 0 2000 2010 2020 2030 2040 2050 Year Fig. 15-5, p. 378
Case Study: World Oil Supplies • Based on different sets of assumptions in their computer models, geologists expect global crude oil production to peak in the next 5 to 38 years (Miller, 2009). • China imports about 33%, 50% by 2010 • Japan imports virtually 100% • EU imports 50%, 70% by 2020
OIL • Burning oil for transportation accounts for 43% of global CO2 emissions. Figure 16-7
Trade-Offs Conventional Oil Advantages Disadvantages Ample supply for 42–93 years (?) Need to find substitutes within 50 years Low cost (with huge subsidies) Artificially low price encourages waste and discourages search for alternatives High net energy yield Easily transported within and between countries Air pollution when burned Low land use Technology is well developed Releases CO2 when burned Efficient distribution system Moderate water pollution Fig. 16-7, p. 363
CO2 Emissions • CO2 emissions per unit of energy produced for various energy resources, compared to coal burned directly for industrial heat. Next
Coal-fired electricity 286% Synthetic oil and gas produced from coal 150% 100% Coal 92% Oil sand 86% Oil 58% Natural gas Nuclear power fuel cycle 17% 10% Geothermal Fig. 16-8, p. 363
Heavy Oils:Oil Sands • Oil sands (a.k.a. tar sands) contain a thick and sticky heavy oil called bitumen.
Oil Sands • Alberta, Canada has 75% of the world’s known reserves of oil sands. • Remaining 25% in Venezuela, Colombia, Russia, & Utah • Canadian & Venezuelan depositsexceed conventional oil depositsin Saudi Arabia and approach those of the entire Middle East. • In 2003, geologists started counting Canadian oil sands along with conventional reserves, giving Canada 15% of the world’s known reserves of crude oil. • China has invested in 2 Canadian oil sand companies, and has built a pipeline from Alberta to shipping ports on the Pacific Coast (!)
Oil Sands • Producing crude oil from oil sands currently costs $13 per barrel, compared to $1-2 per barrel for Saudi oil and $7.50-$10 per barrel in the US. • Severe environmental impacts from oil sands: • Uses large volumes of water • Huge amounts of toxic sludge • Large inputs of natural gas • Boreal forest turned to “moonscape” • Massive mounds of toxic tailings
Heavy Oils:Oil Shales Oil shales contain a waxy, solid, combustible mixture of hydrocarbons called kerogen. • Kerogen can be heated to yield a distillate called shale oil. Figure 16-9
Oil Shales • 50% of global oil shale reserves are in the Western US (USA: “the Saudi Arabia of oil shale”) • Green River Formation in Wyoming, Utah, Colorado • Potentially 3x Saudi conventional oil reserves • Could meet current US demands for 110 years. • Estimated global supplies are about 240x global conventional supplies. • Could meet 25% of global demand by 2020 • Low grade deposits • Energy, time, and money to convert kerogen to crude oil • Higher environmental impact than conventional oil extraction
Shell Oil has the current best process for extracting shale oil in situ
Heavy Oils from Oil Sand and Oil Shale: Will Sticky Black Gold Save Us? • Heavy and tarlike oils from oil sand and oil shale could supplement conventional oil, but there are environmental problems. • High sulfur content (releases sulfur dioxide, SO2) • Extracting and processing produces: • Toxic sludge • Uses and contaminates larges volumes of water • Requires large inputs of natural gas which reduces net energy yield.