Download
1 / 1
40 likes | 174 Views
Economics of Hauling Dairy Slurry and Its Value in Wisconsin Corn Grain Systems Gregg R. Sanford † , Joshua L. Posner † , Gregg L. Hadley ‡ † Department of Agronomy, the University of Wisconsin – Madison ‡ Department of Agricultural Economics, the University of Wisconsin – River Falls.

E N D
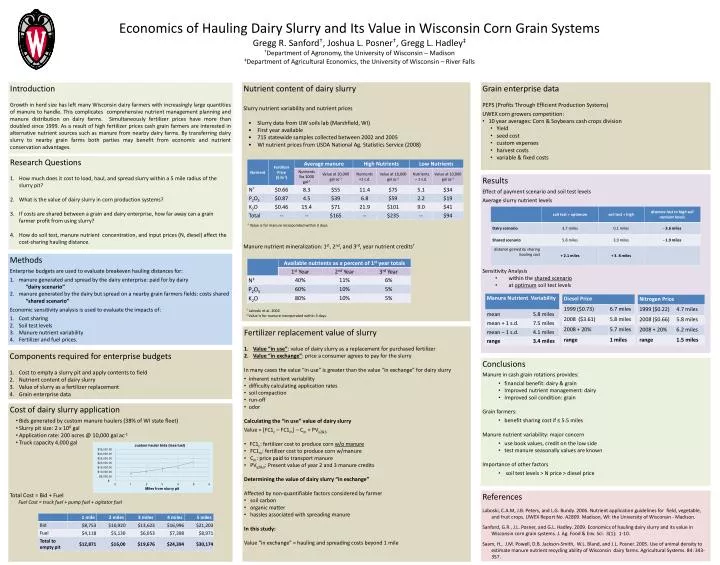
Economics of Hauling Dairy Slurry and Its Value in Wisconsin Corn Grain Systems Gregg R. Sanford†, Joshua L. Posner†, Gregg L. Hadley‡ †Department of Agronomy, the University of Wisconsin – Madison ‡Department of Agricultural Economics, the University of Wisconsin – River Falls • Grain enterprise data • PEPS (Profits Through Efficient Production Systems) • UWEX corn growers competition: • 10 year averages: Corn & Soybeans cash crops division • Yield • seed cost • custom expenses • harvest costs • variable & fixed costs • Nutrient content of dairy slurry • Slurry nutrient variability and nutrient prices • Slurry data from UW soils lab (Marshfield, WI) • First year available • 715 statewide samples collected between 2002 and 2005 • WI nutrient prices from USDA National Ag. Statistics Service (2008) • † Value is for manure incorporated within 3 days. • Manure nutrient mineralization: 1st, 2nd, and 3rd, year nutrient credits† • †Laboski et al. 2006 • ‡ Value is for manure incorporated within 3 days. Introduction Growth in herd size has left many Wisconsin dairy farmers with increasingly large quantities of manure to handle. This complicates comprehensive nutrient management planning and manure distribution on dairy farms. Simultaneously fertilizer prices have more than doubled since 1999. As a result of high fertilizer prices cash grain farmers are interested in alternative nutrient sources such as manure from nearby dairy farms. By transferring dairy slurry to nearby grain farms both parties may benefit from economic and nutrient conservation advantages. Research Questions How much does it cost to load, haul, and spread slurry within a 5 mile radius of the slurry pit? What is the value of dairy slurry in corn production systems? If costs are shared between a grain and dairy enterprise, how far away can a grain farmer profit from using slurry? How do soil test, manure nutrient concentration, and input prices (N, diesel) affect the cost-sharing hauling distance. • Results • Effect of payment scenario and soil test levels • Average slurry nutrient levels • Sensitivity Analysis • within the shared scenario • at optimum soil test levels • Methods • Enterprise budgets are used to evaluate breakeven hauling distances for: • manure generated and spread by the dairy enterprise: paid for by dairy • “dairy scenario” • manure generated by the dairy but spread on a nearby grain farmers fields: costs shared • “shared scenario” • Economic sensitivity analysis is used to evaluate the impacts of: • Cost sharing • Soil test levels • Manure nutrient variability • Fertilizer and fuel prices. • Fertilizer replacement value of slurry • Value “in use”: value of dairy slurry as a replacement for purchased fertilizer • Value “in exchange”: price a consumer agrees to pay for the slurry In many cases the value “in use” is greater than the value “in exchange” for dairy slurry • inherent nutrient variability • difficulty calculating application rates • soil compaction • run-off • odor • Calculating the “in use” value of dairy slurry • Value = [FC1c – FC1m] – Cm + PVy2&3 • FC1c: fertilizer cost to produce corn w/o manure • FC1m: fertilizer cost to produce corn w/manure • Cm: price paid to transport manure • PVy2&3: Present value of year 2 and 3 manure credits • Determining the value of dairy slurry “in exchange” • Affected by non-quantifiable factors considered by farmer • soil carbon • organic matter • hassles associated with spreading manure • In this study: • Value “in exchange” = hauling and spreading costs beyond 1 mile Components required for enterprise budgets Cost to empty a slurry pit and apply contents to field Nutrient content of dairy slurry Value of slurry as a fertilizer replacement Grain enterprise data • Conclusions • Manure in cash grain rotations provides: • financial benefit: dairy & grain • Improved nutrient management: dairy • Improved soil condition: grain • Grain farmers: • benefit sharing cost if ≤ 5.5 miles • Manure nutrient variability: major concern • use book values, credit on the low side • test manure seasonally values are known • Importance of other factors • soil test levels > N price > diesel price • Cost of dairy slurry application • Bids generated by custom manure haulers (38% of WI state fleet) • Slurry pit size: 2 x 10⁶ gal • Application rate: 200 acres @ 10,000 gal ac-1 • Truck capacity 4,000 gal Total Cost = Bid + Fuel Fuel Cost = truck fuel + pump fuel + agitator fuel References Laboski, C.A.M, J.B. Peters, and L.G. Bundy. 2006. Nutrient application guidelines for field, vegetable, and fruit crops. UWEX Report No. A2809. Madison, WI: the University of Wisconsin - Madison. Sanford, G.R., J.L. Posner, and G.L. Hadley. 2009. Economics of hauling dairy slurry and its value in Wisconsin corn grain systems. J. Ag. Food & Env. Sci. 3(1): 1-10. Saam, H., J.M. Powell, D.B. Jackson-Smith, W.L. Bland, and J.L. Posner. 2005. Use of animal density to estimate manure nutrient recycling ability of Wisconsin dairy farms. Agricultural Systems. 84: 343-357.