Download

1 / 79
790 likes | 875 Views
Learning Approach. Research Methods. Question 1. While at school Thomas noticed an increase in aggressive behaviour at break time when more people were outside. This is an example of A negative correlation B no correlation C positive correlation . Answer 1.

E N D
Learning Approach Research Methods
Question 1 • While at school Thomas noticed an increase in aggressive behaviour at break time when more people were outside. This is an example of • A negative correlation • B no correlation • C positive correlation
Answer 1 • While at school Thomas noticed an increase in aggressive behaviour at break time when more people were outside. This is an example of • A negative correlation • B no correlation • C positive correlation – Why is this… (PTO)
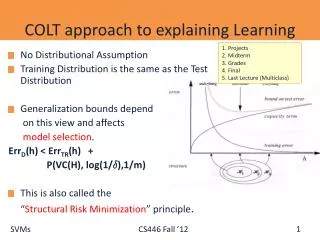
Answer 1 - Correlations • Correlation is a statistical measurement of the relationship between two variables. • Possible correlations range from +1 to –1. • A zero correlation indicates that there is no relationship between the variables. • A correlation of –1 indicates a perfect negative correlation, meaning that as one variable goes up, the other goes down. • A correlation of +1 indicates a perfect positive correlation, meaning that both variables move in the same direction together – So Thomas notices an increase in aggressive behaviourat break time when there are more people outside (why might that be?)
Question 2 • Which sampling method gives an equal chance of a participant being selected? • A Opportunity • B Random • C Self-selected • D Volunteer
Answer 2 • Which sampling method gives an equal chance of a participant being selected? • A Opportunity • B Random – Why? • C Self-selected • D Volunteer
Answer 2 – Random sampling • A random sample is a subset of individuals that are randomly selected from a population. • Because researchers usually cannot obtain data from every single person in a group, a smaller portion is randomly selected to represent the entire group as a whole. • The goal is to obtain a sample that is representative of the larger population.
Answer 2 task • What are the strengths and weaknesses of random sampling?
Answer 2 task • What are the strengths and weaknesses of random sampling? • Random sampling is the best technique for providing an unbiased representative sample of a target population. • Random sampling can be very time consuming and is often impossible to carry out, particularly when you have a large target population, of say all students. • For example if you do not have the names of all the people in your target population you would struggle to conduct a random sample. • If you ask people to volunteer for a study the sample is already not random as some people may be more or less likely to volunteer for things. • Similarly if you decided to put out an advert for participants it would be almost impossible to guarantee that every member of your target population has an equal chance of viewing the advert.
Answer 2 task • What are the strengths and weaknesses of opportunity sampling?
Answer 2 • What about the others – Opportunity sampling • Opportunity sampling is the sampling technique most used by psychology students. • It consists of taking the sample from people who are available at the time the study is carried out and fit the criteria your are looking for. • This may simply consist of choosing the first 20 students in your college canteen to fill in your questionnaire. • The main advantage of opportunity sampling are that it is quick and easy as the sample already exists. • The main disadvantage is that the opportunity sample is biased because the members of it have self selected and are all similar in at least one way, therefore any results will only be truly generalisable to that specific group of people
Answer 2 task • What are the strengths and weaknesses of self-selected sampling?
Answer 2 • What about the others – Self-selected • Self selected sampling (or volunteer sampling) consists of participants becoming part of a study because they volunteer when asked or in response to an advert. • This sampling technique is used in a number of the core studies, for example Milgram (1963). • This technique, like opportunity sampling, is useful as it is quick and relatively easy to do. • It can also reach a wide variety of participants. • However, the type of participants who volunteer may not be representative of the target population for a number of reasons. • For example, they may be more obedient, more motivated to take part in studies and so on.
Question 3 IV is the independent variable and DV is the dependant variable. Identify which of the following statements is correct. • A The IV is manipulated to see the effect on the DV. • B The DV is manipulated to see the effect on the IV. • C The IV is kept constant so it does not affect the results. • D The DV is kept constant so it does not affect the results.
Answer 3 IV is the independent variable and DV is the dependent variable. Identify which of the following statements is correct. • A The IV is manipulated to see the effect on the DV. • B The DV is manipulated to see the effect on the IV. • C The IV is kept constant so it does not affect the results. • D The DV is kept constant so it does not affect the results.
Question 4 An independent groups design is when A - Different participants take part in different experimental conditions. B - Different participants are matched and they take part in different conditions. C - The same participants take part in all the experimental conditions. D - Half the participants do condition 1 first then condition 2, the other half do condition 2 first then condition 1.
Answer 4 An independent groups design is when: A - Different participants take part in different experimental conditions. B - Different participants are matched and they take part in different conditions. (matched pairs design) C - The same participants take part in all the experimental conditions. (repeat measures) D - Half the participants do condition 1 first then condition 2, the other half do condition 2 first then condition 1. (repeat measures)
Answer 4 task • What are the strengths and weaknesses of an independent group design?
Answer 4 task • What are the strengths and weaknesses of an independent group design? • Avoids order effects (such as practice or fatigue) as people participate in one condition only. • If a person is involved in several conditions they may become bored, tired and fed up by the time they come to the second condition, or becoming wise to the requirements of the experiment! • More people are needed than with the repeated measures design (i.e. more time consuming). • Differences between participants in the groups may affect results, for example; variations in age, sex or social background. • These differences are known as participant variables (i.e. a type of extraneous variable).
Answer 4 task Matched pairs design: • What is it? • What are the strengthsand weaknesses?
Answer 4 task Matched pairs design: • One pair must be randomly assigned to the experimental group and the other to the control group. • Reduces participant (i.e. extraneous) variables because the researcher has tried to pair up the participants so that each condition has people with similar abilities and characteristics. • Avoids order effects, and so counterbalancing is not necessary. • Very time-consuming trying to find closely matched pairs. • Impossible to match people exactly, unless identical twins!
Answer 4 task Repeat measures: • What is it? • What are the strengthsand weaknesses?
Answer 4 task Repeat measures: • The same participants take part in each condition of the independent variable. This means that each condition of the experiment includes the same group of participants. • Pro: Fewer people are needed as they take part in all conditions (i.e. saves time) • There may be order effects. Order effects refer to the order of the conditions having an effect on the participants’ behavior. • Performance in the second condition may be better because the participants know what to do (i.e. practice effect). • Or their performance might be worse in the second condition because they are tired (i.e. fatigue effect).
e.g. if you have ordinal data with independent measures design and you’re looking for a difference, you will use Mann-Whitney ‘U.’
Question 5 • In order to carry out a Mann Whitney U Test on data which two of the following statements must be correct? • A The data can be nominal. • B The data can be ordinal. • C The design must be correlational. • D The experimental design must be independent groups. • E The experimental design must be matched pairs.F The experimental design must be repeated measures.
Question 5 Answer • In order to carry out a Mann Whitney U Test on data which two of the following statements must be correct? • A The data can be nominal. • B The data can be ordinal. • C The design must be correlational. • D The experimental design must be independent groups. • E The experimental design must be matched pairs.F The experimental design must be repeated measures.
When choosing a test there are three things to consider: 1) NOIR: What is the level of your data? • Nominal Data • Ordinal Data • Interval and Ratio
When choosing a test there are three things to consider: 1) NOIR: What is the level of your data? • How many people like running? • Sprinting? • Weight training?
When choosing a test there are three things to consider: 1) NOIR: What is the level of your data? • How many people like running? • Sprinting? • Weight training? • Nominal Data!
When choosing a test there are three things to consider: 1) NOIR: What is the level of your data? • Using a likert scale rate the following out of 5 (5 being the highest) of importance to the human body • running? • Sprinting? • Weight training?
When choosing a test there are three things to consider: 1) NOIR: What is the level of your data? • Using a likert scale rate the following out of 5 (5 being the highest) of importance to the human body • running? • Sprinting? • Weight training? • Ordinal Data (ranking some type of order)
When choosing a test there are three things to consider: 1) NOIR: What is the level of your data? • The order established just then is not specific enough. • Therefore we may consider them in terms of interval/ratio data: - Running (burns 200 calories in 30 mins) • Sprinting (burns 400 calories in 30 mins) • Weight training (burns 600 calories in 30 mins)
Nominal Data: • The simplest thing a number can do. • It can tell us how many things there are! • Example - nominal data is a headcount or a tally. • It doesn’t tell us if something is bigger, brighter or bolder, just how many. • For example - show of hands; how many people in the class study English. • Your head count provides nominal data. • If you were replicating Piaget’s research at a primary school you might count the number of five year olds who can successfully complete the three mountains task and compare this to the number of seven year olds (a great study!). • Give some examples of this type of data…
Ordinal Data: • Allows us to put things in order. • For example ‘A’ might be more attractive than ‘B’ but uglier than ‘C’. • We have the order ‘C’ ‘A’’B’ in terms of attractiveness. • Crucially however, we can’t be sure that the difference between ‘C’ and ‘A’ is the same as the difference between ‘A’ and ‘B’. • ‘C’ and ‘A’ might both be very attractive whereas ‘B’ might be less attractive. • We can’t tell that the intervals are the same. • Usain Bolt won the men’s 200m at Beijing, Shawn Crawford was second and Walter Dix third. • From this we can’t tell if the difference between first and second was the same as the difference between second and third. • First, second, third provides ordinal data. • Give some examples of this type of data…
Interval and Ratio: • Allows us to put things in order (ascending or descending) just as ordinal, however this time we can be sure that the intervals are the same. • We know that the difference between 10cm and 11cm is the same as the difference between 15cm and 16cm. • The same applies to weight or mass, temperature and time. • An odd one to consider is IQ. • Some psychologists believe it yields interval/ratio data, others that it is merely ordinal. What do you think? • Generally speaking if you need a piece of equipment to measure it, then its interval or ratio. • For the purposes of statistics interval and ratio are taken as the same. • There is however, a subtle difference. • Ratio has a true zero. • So no minus values, e.g. time, weight, height. • Interval data can be minus e.g. temperature in degrees Celcius. • As a result you can say that 20cm is twice as long as 10cm. You cannot say 20C is twice as hot as 10C.
When choosing a test there are three things to consider: 2) Correlation or difference?
Correlation or difference? • The issue - The relationship between attractiveness and punishment. • This could be done either way: • You could produce an ascending scale of attractiveness and compare this to the level of punishment given to each person. You would predict a negative correlation; as attractiveness increases, level of punishment given decreases. • Alternatively you could split your photographs into two groups, with the beautiful people in one group and less beautiful in the other. Then count the level of punishment offered for each. You are now looking for a difference between the two groups.
When choosing a test there are three things to consider: 3) Repeat or independent measures design?
Repeated or independent measures design: • If you’re using the same group of participants to assess both variables its repeated measures. • If the participants in one condition differ from the other its independent. • There are times when the decision is made for you. • Sex differences, age differences, cultural differences… • They have to be different participants in each condition.
e.g. if you have ordinal data with independent measures design and you’re looking for a difference, you will use Mann-Whitney ‘U.’
Decision timeHaving decided on the above three dimensions, use the chart below to decide which test to use. You will be expected to know about three: Chi squared, Mann-Whitney ‘U’ and Spearman’s ‘rho.’ e.g. if you have ordinal data with independent measures design and you’re looking for a difference, you will use Mann-Whitney ‘U.’
Inferential statistics: • At the end of this you’ll have calculated ONE number. • This number will tell you whether your results are meaningful and statistically significant, or whether they’ve more than likely occurred by chance and are little more than a fluke. • These are your Critical and observed values.
Critical and observed values • The number you calculate is your observed value. • This needs to be compared with the critical value in the appropriate table. • Each test has its own table with various critical values depending on the level of significance (5% (0.05), 1% (0.01), 0.5% (0.005)) of the results being due to chance. • With Spearman’s rho and chi squared tests the number you calculate needs to be equal to or greater than the critical value for your findings to be significant. • ‘Spearman’s rho’ and ‘chi squared’ both contain ‘Rs’ as does the word gReater • ‘Mann Whitney U’ test does not contain an Rsowith this test the critical value needs to be equal to or smaller than the critical value.
Question 6 • A study was carried out to investigate whether kicking off from the starting block with the right foot or left foot gave sprinters an advantage. • 20 participants were asked to take part in two sprints; in one trial they kicked off with their left foot and in another with their right. • It was found that on average kicking off with their right foot gave them an advantage of 80 ms (milliseconds). • Give a non-directional (two-tailed) experimental hypothesis for the study (2).
Help: • A one tailed hypothesis specifies a directional relationship between groups. • Here we are saying that we expect children in Samoa to be further from their mothers than children in Belize. • We not only state that there will be differences between the groups but we specify in which direction the differences will exist. • Anytime we expect a relationship to be directional (i.e. to go one specific way) we are using a one-tailed hypothesis. • This is the opposite of a two-tailed hypothesis. • A two tailed hypothesis would predict that there was a difference between groups, but, would make no reference to the direction of the effect.
Question 6 Answer • 2 marks for an appropriate experimental hypothesis. Partial mark if only the IV or the DV given.A non-directional (two-tailed) hypothesis must be given. 0 marks for a directional or a null hypothesis. • There is a difference in the time taken to sprint/eq; (1 mark) • There is a difference between whether it was the left or right foot/eq; (1 mark) • There will be a difference in the speed/time taken from the starting blocks, depending which foot the sprinters use/eq; (2 marks) • Either moving off with the left foot or the right foot will lead to a decrease in the time taken to push off the starting blocks/eq; (2 marks) • Look for other reasonable ways of expressing a hypothesis.
Question 7 • State the design used in the study.
Question 7 Answer: • State the design used in the study. • Reject methods or ‘same participants’.If more than one answer given accept the first one. • repeated measures • related design • Within groups design • related [single word only] • repeated [single word only]
Question 8: • State the independent variable (IV) for the study.