Download
1 / 94
940 likes | 1.37k Views
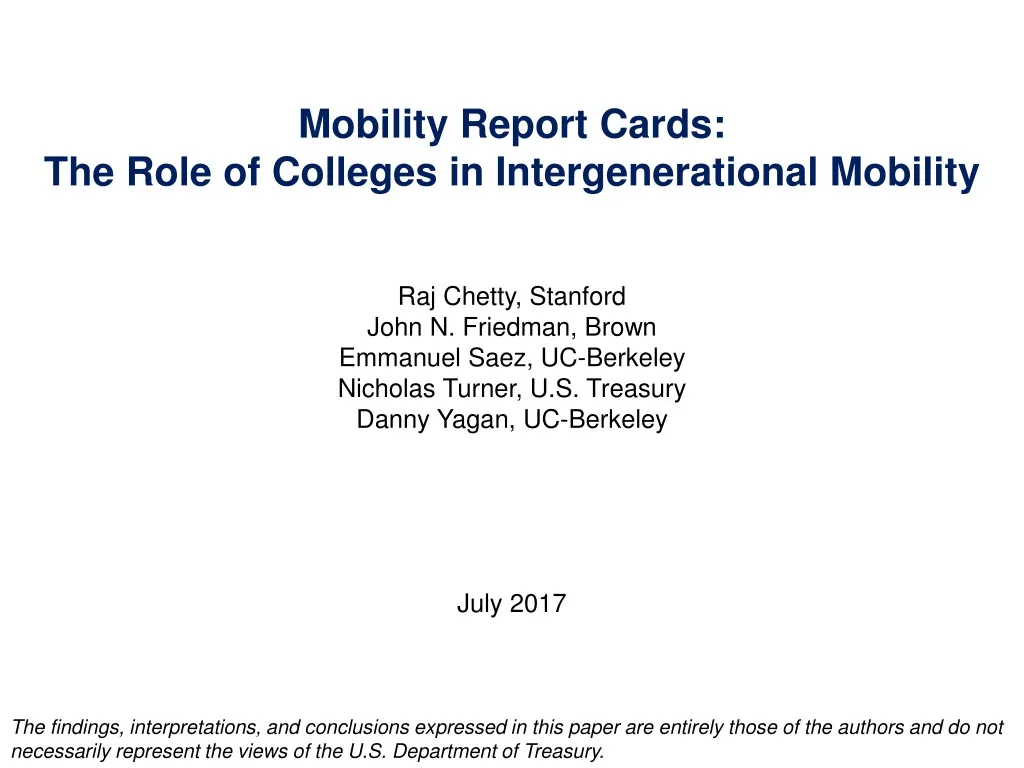
The Distribution of Student and Parent Income Across Colleges in the United States Raj Chetty , Stanford John N. Friedman, Brown Emmanuel Saez, UC-Berkeley Nicholas Turner, U.S. Treasury Danny Yagan , UC-Berkeley July 2017. Mobility Report Cards:

E N D
The Distribution of Student and Parent Income Across Colleges in the United States Raj Chetty, Stanford John N. Friedman, Brown Emmanuel Saez, UC-Berkeley Nicholas Turner, U.S. Treasury Danny Yagan, UC-Berkeley July 2017 Mobility Report Cards: The Role of Colleges in Intergenerational Mobility The findings, interpretations, and conclusions expressed in this paper are entirely those of the authors and do not necessarily represent the views of the U.S. Department of Treasury.
What role do colleges play in intergenerational income mobility? • Large returns to college attendance suggest that higher education can be an important pathway to upward mobility • But inequality in access between high- and low-income families may limit (or even reverse) this effect • Evaluating colleges’ role in mobility requires analysis of two factors: • [Outcomes] Which colleges are most effective in helping children climb the income ladder? • [Access] How can we increase access to such colleges for students from low-income families? Introduction
Outline • Access: Parents’ Marginal Income Distributions by College • Outcomes: Distributions of Students’ Earnings by College • Differences in Mobility Rates Across Colleges • Trends in Access and Mobility Rates
Data • Data source: de-identified data from 1996-2014 income tax returns • Includes data on income of non-filers through information returns filed by employers (W-2 forms) • Primary sample: all children in 1980-82 birth cohorts claimed as dependents by tax filers in the U.S. • Earliest cohorts where we can link almost all children to parents • Approximately 11 million children • Extended sample: 1978-1991 birth cohorts • Used to study changes in access over time and for robustness
Measuring College Attendance • All Title IV institutions report student attendance to IRS on Form 1098-T • 1098-T data covers 95% of enrolled students; students who pay no tuition sometimes not covered • Use Dept. of Ed data (NSLDS) on students receiving Pell grants to identify these students • Baseline: define college attendance as most-attended college between ages 19-22 • Similar results obtained with alternative definitions (e.g., college attended at age 20) • Following established disclosure standards, all college-specific numbers are estimates (approx. +/- 1% measurement error)
Measuring Parent Income • Parent income: mean pre-tax household income during five year period when child is aged 15-19 • For filers, use Adjusted Gross Income reported on form 1040 • For non-filers, use W-2 wage earnings + UI income • All incomes measured in 2015 dollars • Focus on percentile ranks, ranking parents relative to other parents with children in same birth cohort
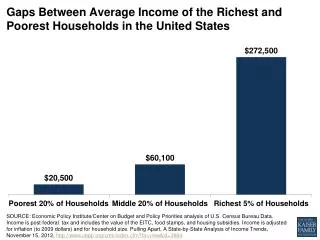
Parent Household Income Distribution For Parents with Children in 1980 Birth Cohort 20th Percentile = $25k Median = $60k 60th Percentile = $74k 80th Percentile = $111k Density 99th Percentile = $512k 0 100 200 300 400 500 Parents' Mean Household Income when Child is Age 15-19 ($1000)
Parent Income Distribution at Harvard 1980-82 Child Birth Cohorts 80 70.3% 60 Percent of Students 40 20 13.2% Top 1% 8.1% 5.3% 3.0% 0 1 2 3 4 5 Parent Income Quintile 15.4%
Parent Income Distribution by Percentile Ivy Plus Colleges 15 10 Percent of Students 5 Note: “Ivy Plus” = Ivy League, Chicago, Stanford, MIT, Duke 0 0 20 40 60 80 100 Parent Rank
Parent Income Distribution by Percentile Ivy Plus Colleges 15 14.5% of students from top 1% 10 Percent of Students 5 Note: “Ivy Plus” = Ivy League, Chicago, Stanford, MIT, Duke 0 0 20 40 60 80 100 Parent Rank
Parent Income Distribution by Percentile Ivy Plus Colleges 15 14.5% of students from top 1% 10 Percent of Students 5 13.5% of students from bottom 50% 0 0 20 40 60 80 100 Parent Rank
Parent Income Distribution by Percentile Ivy Plus Colleges 15 14.5% of students from top 1% 10 More students from the top 1% than the bottom 50% Percent of Students 5 13.5% of students from bottom 50% 0 0 20 40 60 80 100 Parent Rank
Parent Income Distribution by Percentile Ivy Plus Colleges 15 14.5% of students from top 1% 10 Percent of Students 5 3.8% of students from bottom 20% 0 0 20 40 60 80 100 Parent Rank
Parent Income Distribution by Percentile Ivy Plus Colleges 15 14.5% of students from top 1% 10 Probability of attending an elite private college is 77 times higher for children in the top 1% compared to the bottom 20% Percent of Students 5 3.8% of students from bottom 20% 0 0 20 40 60 80 100 Parent Rank
Parent Income Distributions by Quintile for 1980-82 Birth Cohorts At Selected Colleges 80 Harvard University 60 Percent of Students 40 20 0 1 2 3 4 5 Parent Income Quintile
Parent Income Distributions by Quintile for 1980-82 Birth Cohorts At Selected Colleges 80 Harvard University UC Berkeley 60 Percent of Students 40 20 0 1 2 3 4 5 Parent Income Quintile
Parent Income Distributions by Quintile for 1980-82 Birth Cohorts At Selected Colleges 80 Harvard University UC Berkeley SUNY-Stony Brook 60 Percent of Students 40 20 0 1 2 3 4 5 Parent Income Quintile
Parent Income Distributions by Quintile for 1980-82 Birth Cohorts At Selected Colleges 80 Harvard University UC Berkeley SUNY-Stony Brook 60 Glendale Community College Percent of Students 40 20 0 1 2 3 4 5 Parent Income Quintile
Parent Income Distributions by Quintile for 1980-82 Birth Cohorts At Selected Colleges 80 Harvard University UC Berkeley SUNY-Stony Brook 60 Glendale Community College Percent of Students 40 Top 1% 20 0 1 2 3 4 5 Parent Income Quintile
Distribution of Access Across Colleges (Enrollment-Weighted) Harvard = 3.0% Berkeley = 8.8% SUNY-Stony Brook = 16.4% Density Glendale Community College = 32.4% 0 20 40 60 Percent of Parents in Bottom Quintile
Distribution of Access Across Colleges (Enrollment-Weighted) Harvard = 3.0% Berkeley = 8.8% SUNY-Stony Brook = 16.4% Density Glendale Community College = 32.4% 0 20 40 60 Percent of Parents in Bottom Quintile
Distribution of Access Across Colleges (Enrollment-Weighted) p10 = 3.7% p50 = 9.3% p90 = 21.0% Density SD(Pct. of Parents in Q1) = 7.6% 0 20 40 60 Percent of Parents in Bottom Quintile
Distribution of Access Across Colleges (Enrollment-Weighted) p10 = 3.7% p50 = 9.3% p90 = 21.0% Density Income Segregation Across Colleges is Comparable to Segregation Across Census Tracts in Average American City 0 20 40 60 Percent of Parents in Bottom Quintile
Lessons on Access • Fact #1: Income segregation across colleges is comparable to segregation across Census tracts in the average American city • Income is especially concentrated at elite private schools • No evidence of a “missing middle” at elite private colleges • Likelihood of attending elite private schools is strictly increasing in parental income, even relative to elite public schools
Part 2 Outcomes: Distributions of Student’s Earnings by College
Measuring Student Earnings • Individual labor earnings = wages + self-emp. Income + foreign wages • Compute percentile ranks by ranking children within birth cohorts • Using data going back to 1978 cohort, we see that ranks stabilize by age 32 at all colleges
Mean Child Rank vs. Age at Income Measurement, By College Tier 90 Ivy Plus Other Elite Other Four-Year Two-Year 80 Mean Child Earnings Rank 70 60 50 25 27 29 31 33 35 Age of Income Measurement
Mean Child Rank vs. Age at Income Measurement, By College Tier 90 Ivy Plus Other Elite Other Four-Year Two-Year 80 Mean Child Earnings Rank 70 60 Cannot Link Children to Parents 50 Corr(Rank at 32, Rank at 36) = 0.986 25 27 29 31 33 35 Age of Income Measurement
Measuring Student Earnings • Individual labor earnings = wages + self-emp. income + foreign wages • Compute percentile ranks by ranking children within birth cohorts • Using data going back to 1978 cohort, we see that ranks stabilize by age 32 at all colleges • Broader income concepts (e.g., AGI) differ from individual labor earnings primarily because of marriage
Measuring Student Earnings • Individual labor earnings = wages + self-emp. income + foreign wages • Compute percentile ranks by ranking children within birth cohorts • Using data going back to 1978 cohort, we see that ranks stabilize by age 32 at all colleges • Broader income concepts (e.g., AGI) differ from individual labor earnings primarily because of marriage • Baseline definition: individual earnings in 2014, measured at ages 32-34 for 1980-82 birth cohorts
Distribution of Children’s Individual Labor Earnings at Age 34 1980 Birth Cohort 20th Percentile = $1k Median = $28k 80th Percentile = $58k 99th Percentile = $197k Density 0 50 100 150 200 250 Child's Individual Earnings at Age 34 ($1000)
Student Earnings Outcomes by College • Characterize children’s earnings ranks conditional on their parents’ rank by college
Mean Child Rank at Age 34 vs. Parent Income Rank Full Population 80 70 60 Child Rank 50 40 National (Slope: 0.288) 30 0 20 40 60 80 100 Parent Rank
Mean Child Rank at Age 34 vs. Parent Income Rank UC-Berkeley 80 70 60 Child Rank 50 40 30 0 20 40 60 80 100 Parent Rank National (Slope: 0.288) • UC Berkeley (Slope: 0.060)
Mean Child Rank at Age 34 vs. Parent Income Rank EliteColleges 80 70 60 Child Rank 50 40 National (Slope: 0.288) Elite Colleges (Slope: 0.065) 30 0 20 40 60 80 100 Parent Rank
Mean Child Rank at Age 34 vs. Parent Income Rank All 4-Year Colleges 80 70 60 Child Rank 50 40 National (Slope: 0.288) Elite Colleges (Slope: 0.065) Other 4-Year Colleges (Slope: 0.095) 30 0 20 40 60 80 100 Parent Rank
Mean Child Rank at Age 34 vs. Parent Income Rank All Colleges 80 70 60 Child Rank 50 40 30 0 20 40 60 80 100 National (Slope: 0.288) Elite Colleges (Slope: 0.065) Other 4-Year Colleges (Slope: 0.095) 2-Year Colleges (Slope: 0.110) Parent Rank
Mean Child Rank at Age 34 vs. Parent Income Rank All Colleges – Male Children Only 80 70 60 Child Rank 50 40 National (Slope: 0.334) Elite Colleges (Slope: 0.091) Other 4-Year Colleges (Slope: 0.115) 30 2-Year (Slope: 0.127) 0 20 40 60 80 100 Parent Rank
Lessons on Outcomes • Fact #2: At any given college, students from low- and high- income families have very similar earnings outcomes • Colleges effectively “level the playing field” across students with different socioeconomic backgrounds whom they admit • No indication of “mismatch” of low-SES students who are admitted to selective colleges under current policies • Low-SES students at less-selective colleges are unlikely to do better than high-SES students at more-selective colleges • Within-college earnings gradient therefore places a tight upper bound on the degree of mismatch • Any current affirmative action policies for low-income students have little cost to universities in terms of students’ outcomes
Mobility Report Cards • Combine data on parents’ incomes and students’ outcomes to characterize colleges’ mobility rates • Begin by measuring upward mobility as reaching top quintile • Turn to upper-tail success (reaching top 1%) later
Mobility Report Cards Columbia vs. SUNY-Stony Brook 80% Columbia SUNY-Stony Brook 60% Percent of Students 40% 20% 0% 1 2 3 4 5 Parent Income Quintile
Mobility Report Cards Columbia vs. SUNY-Stony Brook 80% Columbia SUNY-Stony Brook 60% Success Rates (Students' Outcomes) Percent of Students 40% Access (Parents' Incomes) 20% 0% 1 2 3 4 5 Parent Income Quintile
Rates of Mobility • Define a college’s mobility rate (MR) as the fraction of its students who come from bottom quintile and end up in top quintile Mobility Rate = Success Rate x Access P(Child in Q5 & Parent in Q1) P(Child in Q5| Parent in Q1) P(Parent in Q1) • E.g., SUNY-Stony Brook: 8.4% = 51.2% x 16.4% • The mobility rate should be interpreted as an accounting measure rather than a causal effect
100 80 60 Columbia Success Rate: P(Child in Q5 | Par in Q1) SUNY-Stony Brook 40 20 0 0 20 40 60 Access: Percent of Parents in Bottom Quintile Mobility Rates: Success Rate vs. Access by College
100 80 60 Columbia Success Rate: P(Child in Q5 | Par in Q1) SUNY-Stony Brook 40 20 0 0 20 40 60 Access: Percent of Parents in Bottom Quintile Mobility Rates: Success Rate vs. Access by College
100 80 MR = 1.6% (50th Percentile) 60 Success Rate: P(Child in Q5 | Par in Q1) 40 20 0 0 20 40 60 Access: Percent of Parents in Bottom Quintile Mobility Rates: Success Rate vs. Access by College MR = Success Rate x Access
100 MR = 3.5% (90th Percentile) 80 MR = 1.6% (50th Percentile) 60 Success Rate: P(Child in Q5 | Par in Q1) 40 20 0 MR = 0.9% (10th Percentile) 0 20 40 60 Access: Percent of Parents in Bottom Quintile Mobility Rates: Success Rate vs. Access by College MR = Success Rate x Access • SD of MR = 1.30%
100 80 Princeton MIT Stanford 60 Columbia Harvard Yale Success Rate: P(Child in Q5 | Par in Q1) Brown Duke 40 Chicago 20 0 0 20 40 60 Access: Percent of Parents in Bottom Quintile Mobility Rates: Success Rate vs. Access by College Ivy Plus Colleges (Avg. MR = 2.2%)