Download
1 / 12
120 likes | 258 Views
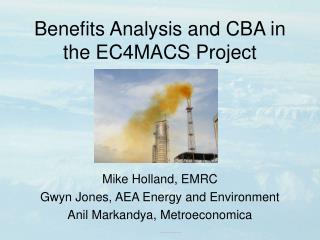
GHG-AFOLU and EC4MACS. Adrian Leip Joint Research Centre Institute for Environment and Sustainability Climate Change Unit. Approach in CAPRI-DynaSpat. CAPRI – economic model with regional environmental indicators Ammonia volatilization, IPCC approach for GHG emissions, …

E N D
GHG-AFOLU and EC4MACS Adrian Leip Joint Research Centre Institute for Environment and Sustainability Climate Change Unit
Approach in CAPRI-DynaSpat • CAPRI – economic model with regional environmental indicators • Ammonia volatilization, • IPCC approach for GHG emissions, … • CAPRI – economic model with sub-regional environmental indicators • Full GHG balance in livestock/crop production systems • Nutrient balances, … • Downscaling to 1 km pixels • Linkage to process-based models
Agricultural land use map • area of interest: EU27 • 30 Crops: Common wheat, Durum Wheat, Barley, Rye , Oats, Maize, Rice, Other cereals, Potatoes, Sugar beet, Other root crops, Sunflower, Rape and turnip rape, Soya, Fibre and oleaginous crops, Tobacco, Other non permanent industrial crops, Dry pulses, Tomatoes, Other fresh vegetables, Floriculture, Fodder other on arable land, Fallow land, Fruit tree and berry plantations, Citrus fruits, Olive groves, Vineyards, Nurseries, Other crops, Permanent grass and grazing • temporal reference: year ~2000, linked to CAPRI scenarios • resolution: 1km by 1km • STEP1: Delineate Homogenous Spatial Mapping Units -HSMU’s- i.e. areas with similar environmental conditions (Soil Mapping Unit, Corine, FSS-NUTS, slope) → ~140000 HSMU’s in EU15) • STEP2: Construct models (binomial logit) to estimate “crop shares” at observation points (LUCAS, ESTAT) in different land cover classes (Corine2000) and regions (explanatory variables soil, climate, topography) • STEP3: Estimating the shares of the individual crops in the HSMU’s consistently with ESTAT statistics at NUTS 2 level (highest posterior density)
Agricultural Land Use Map – Results I Barley Grassland
Agricultural Land Use Map – Results II Softwheat Maize
Applications • Biodiversity indicator (CAPRI-DynaSpat) • Energy use in Agriculture (CAPRI-DynaSpat) • Link to Land-Use Change model (CLUE) (NitroEurope) • Carbon sequestration modeling (CarboEurope) • Nitrogen and Carbon interactions (NitroEurope) • Cross Compliance Impact Assessment (CCAT) • Pest Risk Assessment (PRATIQUE) • Rural Development indicator (RWER) • Extension to forestry • Extension to livestock production • … Biodiversity index
DNDC-Model ecological ecological climate soil vegetation human impact driver driver mean daily mineralisation water daily annual evapotrans- demand growth temperat. piration very labile labile resistant degradable organic matter water uptake N- LAI water + NH transpira- 4 demand depending evaporation movement tion very labile resistant albedo in the soil degradable microbial matter DOC water stress grain N-uptake soil soil moisture O -diffusion labile resistant T-profile 2 profile CO degradable humines 2 wood root O -profile root Soil climate respiration 2 non-degradable organic matter crop growth Effect of temperature and moisture on mineralisation anaerobic predicted soil substrate (C, N ) moisture pH temperature environmental forces balloon denitrification nitrification methanogenesis + DOC NH DOC CO 4 2 Nitrat - denitrifier clay- nitrifier NH minerals 3 - NO methanogenic bacteria 2 - NO N O 3 CH -oxidation 2 Nitrit - 4 NO denitrifier NH CH methanotrophic bacteria CO DOC NO 3 4 2 N O 2 - diffusion - NO - gasbubbles N O - 3 exchange of N 2 - plant tranpsort denitrifier 2 - NO, N O, NO 2 3 predicted gas fluxes predicted gas fluxes emission of NO, N O, N , NH and CH 2 2 3 4 Changsheng Li, 1992, 2000, …
CAPRI DNDC CAPRI-DNDC Data Flow Complete and consistent set of agricultural production statistics at the NUTS 2 level EUROSTAT national/regional statistics A priori estimates (environmental parameters, LUCAS observation points) Disaggregation of land use into HSMU MARS potential yield estimates DNDC maximum yield Production statistics estimation (HSMU level) FAO/IFA national fertiliser use by crop, MAFF soil nutrient status Nitrogen losses - partitioning Input parameter estimation for a closed nitrogen balance (soil surface, HSMU level) HSMU aggregation DNDC input files DNDC-EUROPE: simulation of environmental indicators
DNDC Emission Scenarios – Common Wheat N-N2O Leached N N2O/N2 Ratio No nitrogen application Mineral fertilizer+manure nitrogen application max > 10 kg N/ha/year max > 50 kg N/ha/year max >3
DNDC Emission Scenarios – Barley N-N2O Leached N N2O/N2 Ratio No nitrogen application Mineral fertilizer+manure nitrogen application max > 10 kg N/ha/year max > 50 kg N/ha/year max >3
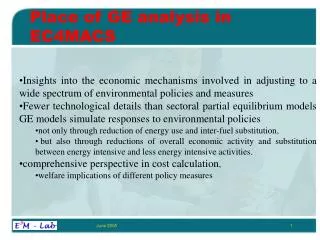
Pathway of nitrogen lossesweighted average of all crops simulated [kg N/ha/year]
Possible interactions • Improve environmental indicators in CAPRI • Link to GAINS • Stratification of emission factors, fractions or functions? • Stratification of abatement technology efficiency • Evidencing interactions / side effects of activities or measures • Can acceptance be improved if based on validated model? • Improved input data for modeling (e. g. soil carbon) • Zooming into area of focus (e.g. mountain areas, NVZ, NATURA2000) • Potential to include local policies? • Link to nitrate leaching • More attention to crop growth module impact assessment • Comparison of land use map with SEI land cover map