Download
1 / 16
160 likes | 330 Views
Performance Benchmarks 2008 European Private Equity. Conducted by Thomson Reuters on behalf of EVCA. Methodology for Performance Benchmarks. All calculations are done at the fund level by Thomson Reuters based on cash flows and NAVs reported by participating GPs

E N D
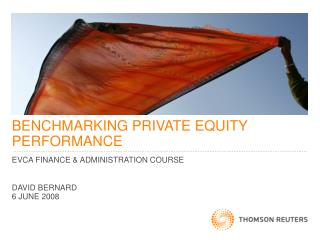
Performance Benchmarks 2008European Private Equity Conducted by Thomson Reuters on behalf of EVCA
Methodology for Performance Benchmarks • All calculations are done at the fund levelby Thomson Reuters based on cash flows and NAVs reported by participating GPs • Returns are net of management fees and carried interest • Returns are calculated with cash flows in Euros for European figures • Cash flow database contains 1,331 European funds since its inception • Definitions: • Pooled IRR: IRR for a group of funds where their cash flows have been aggregated before the IRR calculation • Investment Horizon Return: IRR calculated with Net Asset Value at the beginning of period as capital outflow, Net Asset Value at the end of period, and actual cash flows in between
GPs Global economic downturn Lack of leverage for new deals Difficult exit environment Non-existent IPO market LPs Financial crisis Global economic downturn Low distributions lead to difficulties in servicing commitments Denominator effect triggers over-exposure to Private Equity Background Extremely difficult market conditions for GPs and LPs in the last 12 months
Investment BenchmarksDatabaseEuropean Sample Growth Source: Thomson Reuters on behalf of EVCA
Mid- to Long-Term IRRs for European Venture European Venture 3-,5-,10-Year Rolling IRRs Returns calculated in EUR Source: Thomson Reuters/EVCA
3-year Buyout Horizon IRR in Europe Declines SteeplyMid- to Long-Term Performance of European Buyout Funds Remains Strong European Buyouts 3-,5-,10-Year Rolling IRRs Returns calculated in EUR Source: Thomson Reuters/EVCA
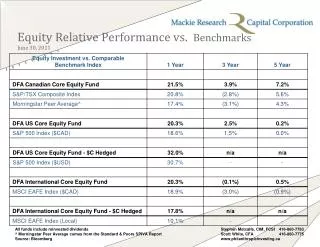
European Buyout Funds Show Best Performance Over a 5-year Horizon Europe USA Returns for Europe calculated in EUR Returns for US calculated in US$ Source: Thomson Reuters/EVCA
European Top Quarter Performance at Above 20% Funds Formed 1980-2008 Net Pooled for the Quarter Net IRR Percentile 100 22.7% 9.5% 75 6.0% 0.0% 50 -2.5% -6.0% 25 -27.2% Source: Thomson Reuters/EVCA
Short-Term Performance Reflects the Impact of the Downturn Long-Term Performance Remains Steady European Private Equity Funds Formed 1980-2008Investment Horizon IRR (%) for period ending 31-Dec-2008 Source: Thomson Reuters/EVCA
Mid-Size Venture Funds Seem Most Hit by the Crisis Formed 1980-2008 Net IRRs to Investors Investment Horizon IRR (%) for period ending 31-Dec-2008 These results refer to the fund size, not the deal size Source: Thomson Reuters/EVCA
On the Buyout Side - Mega Funds Most ImpactedFormed 1980-2008 Net IRRs to Investors Investment Horizon IRR (%) for period ending 31-Dec-2008 These results refer to the fund size, not the deal size Source: Thomson Reuters/EVCA
Private Equity Investment During Downturns Generates Superior Performance Net IRRs to Investors Grouped By Vintage Years From Inception to 31-Dec-2008 Source: Thomson Reuters on behalf of EVCA
Private Equity Returns Beat all Public Market Indices Comparators: annualised net pooled IRRs since inception to 31.12.2008 Source: Thomson Reuters/EVCA
Private Equity performance - superior to the performance of public market comparators Annualised net pooled IRRs since inception to 31.12.2008 9.5% 8.9% 2.7% -1.8% *Comparators are Internal Rates of Return (IRR). IRRs for public market indices are calculated by investing the equivalent cash flows that were invested in private equity into the public market index. Then an equivalent IRR is calculated for each index. Calculations based on methodology proposed by J Coller and published by A Long and C Nickles. Source: Thomson Reuters/EVCA
Summary • Mid- to Long-term performance • Private equity registers close to 10% net IRR with pooled average top quarter IRR since inception of 22.7% • Private equity performance superior to the performance of all three public market comparators • Shorter-term performance • Reflects the impact of the economic downturn and financial crisis with 1-year horizon IRR at -30.5% • Returns over the 3-year horizon also strongly affected by the economic crisis with buyout IRR of 3.5% and venture IRR of -0.6%
2008 European Private Equity Performance Benchmarks • For questions please contact: • Thomson Reuters: rosette.tyers@thomsonreuters.com • EVCA: zornitsa.pavlova@evca.eu