Download
1 / 17
170 likes | 280 Views
Autonomous vehicle monitoring of movement and habitat use by mobile nearshore species. Patrick Lane University of Alaska Fairbanks School of Fisheries and Ocean Sciences. Introduction Goals Study Site and Test Species Completed Work Habitat Surveys Test Species Abundance Surveys

E N D
Autonomous vehicle monitoring of movement and habitat use by mobile nearshore species Patrick Lane University of Alaska Fairbanks School of Fisheries and Ocean Sciences
Introduction Goals Study Site and Test Species Completed Work Habitat Surveys Test Species Abundance Surveys Preliminary Movement Information Conclusions Future Directions Acknowledgements
Julie Nielson Introduction • Sampling the distribution of nearshore, subtidal species can be difficult. • Movement patterns complicate the study of distribution and have important ecological and conservation implications. • Mobile organisms: energy transfer, spatial scale, conservation strategy • Value of measuring animal movement NOAA AFSC NOAA AFSC (Pittman and McAlpine 2001, Holsman et al. 2006).
VEMCO Inc. Introduction • Movement, habitat use and spatial management strategies • Nearshore movement assessment techniques • Nearshore habitat use assessment techniques • Ultrasonic telemetry Julie Nielson NOAA AFSC
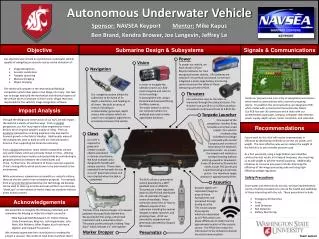
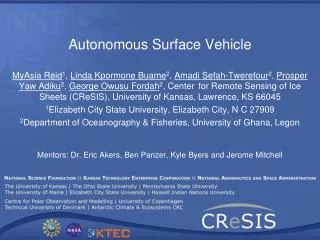
Goals Paul Mahacek SCU RSL NOAA 1) Design and test an autonomous surface vehicle (ASV) telemetry monitoring scheme (SCU RSL). 2) Compare movement rates to manual telemetry monitoring. 3) Use side-scan sonar habitat maps and ASV telemetry data to monitor habitat use (NOAA Hydropalooza). • Compare to diver visual observations of tagged individuals 4) Assess seasonal changes in habitat structure. • Seasonal variability in habitat structure and integrity of one-time remote mapping
Kasitsna Bay • Adjacent to NOAA/UAF Kasitsna Bay Laboratory • Variable habitat structure • Depth less than 40 m • Abundance of test organism: the helmet crab (Telmessus cheiragonus) Kachemak Bay Homer Kachemak Bay Kasitsna Bay Seldovia UAF Kasitsna Bay Laboratory
Test Species:Telmessus cheiragonus • Reaches a size of up to 10 cm carapace length • Intertidal to 110 m but not common below 30 to 40 m • Bristled carapace allows for easy attachment of tags • Found in a variety of habitats ranging from silt to rock seafloor NOAA/ Jan Haaga
Completed Work • Habitat Availability • Quantify habitat structure • Assess habitat variability • Test Species Abundance • Quantify availability • Placement of future collections • Preliminary Movement Information • Area to monitor vs. area used for tagging
Methods: Habitat Availability • July and August 2008 • 12 30 m transects across 4 randomly placed sites 5 , 10 , 15 m • 6 randomly placed 1 x 1 m quadrats • % cover understory algal canopy • % cover substrate(silt, sand, gravel, cobble, boulder, bedrock, shell debris) • Rugosity measured at 6 random points Kasitsna Bay UAF Kasitsna Bay Laboratory
Results: Habitat Availability 15 m 10 m 5 m 100 102 N = 4 N = 4 N = 4 80 Percent Cover (Average + 1SD) 60 40 20 Silt Silt Silt Sand Sand Sand Cobble Cobble Cobble Boulder Bedrock Shell Boulder Bedrock Shell Boulder Bedrock Shell Gravel Gravel Gravel Understory Understory Understory Rugosity: 100.7 – 109.0 cm/m No significant difference based on depth (Tukey’s HSD p > 0.05)
Methods: Test Species Abundance • July and August 2008 • Same sites surveyed as for habitat availability surveys • 12 30 x 4 m (120 m2) transects across 4 sites at 5, 10, 15 m • All test species counted, measured, and sexed • Size threshold: 11 individuals collected, measured, and weighed
Results: Test Species Abundance • Carapace length of 40 mm is the minimum size to tag • Only 4 females in all 12 transects • Abundance for males is shown: 5 m 10 m 15 m N = 4 N = 4 N = 4 Number of Individuals per 120m2 (Average + 1SD) <40 mm >40 mm <40 mm >40 mm <40 mm >40 mm Size (carapace length in mm)
Methods: Preliminary Movement Information • November 2008: 4 male test organisms tagged with VEMCO V9 ultrasonic transmitters using epoxy and fiberglass • February 2009: Study site monitored using manual telemetry and locations of three tagged individuals recorded using GPS • Point-to-point minimal movement estimates calculated using UTM coordinates (84-85 days between release and monitoring) (Taggert et al. 2007)
Results: Movement • Minimal movement estimates (84-85 days) • Future monitoring planned Not Located 281 m 84 m Kachemak Bay 31 m Kasitsna Bay 100 m
Conclusions USGS John Thedinga • Habitat Availability: • Substrate type and algal cover • Variable across site • Test Species Abundance: • Male individuals will be used for future tagging • Preliminary Movement Information: • Within study area so far • Range of distances moved NOAA/ Jan Haaga
Mike Kenner UCSC Future Directions • Habitat mapping (NOAA Hydropalooza). • Scuba habitat availability surveys (summer, fall, winter, spring) • Manual tracking, diver observations and autonomous surface vehicle ASV tracking (summer 2009 to summer 2010) • Comparison of ASV tracking and sonar mapping approach to manual telemetry and scuba habitat observations • Movement rates and habitat use data Paul Mahacek SCU RSL
Acknowledgements Advisory Committee Brenda Konar, Ginny Eckert, Stephen Jewett Funding -Rasmuson Fisheries Research Center -NOAA West Coast and Polar Regions Undersea Research Center -Vemco Inc. NOAA/UAF Kasitsna bay Laboratory Dave Christie, Kris Holderied, Hans Pederson Field Volunteers Melissa Deiman, Terry Efird, Heloise Chenalot, Toben Spurkland, Nathan Stewart, Martin Shuster, Renato Boras