Download
1 / 13
130 likes | 136 Views
Pandemic Influenza A (H1N1) 2009 infection in Indigenous populations in Australia, 2009. Polly Wallace Australian Master of Applied Epidemiology program (FETP) Field placement at the Department of Health and Ageing. Pandemic Influenza H1N1 2009 (pH1N1 ) Virus in Mexico, Canada and the US

E N D
Pandemic Influenza A (H1N1) 2009 infection in Indigenous populations in Australia, 2009 Polly Wallace Australian Master of Applied Epidemiology program (FETP) Field placement at the Department of Health and Ageing
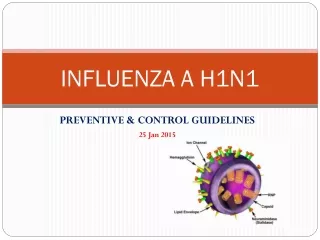
Pandemic Influenza H1N1 2009 (pH1N1) Virus in Mexico, Canada and the US WHO declared pandemic June 2009 Beginning of winter andusual influenza seasonin Australia Indigenous health Background
Aim: To compare Indigenous and non-Indigenous pH1N1 cases in Australia to determine severity of infection. Case definition: Laboratory confirmed pH1N1 cases notified from April to December 2009 in Australia. Data: National data collected using NetEpi Methods
226 variables 53 variables Cleaning & checking the data took months Jurisdictions completed different variables within the dataset Jurisdictions completed different fields for the same variable, leaving others empty Jurisdictions provided ‘cleaned’ data at different times Data cleaning issues
Epidemic curve, H1N1 by onset week, Australia, 2009 PROTECT CONTAIN
The dataset contained 37,736 notifications 11% (4,063) cases were Indigenous 39% (14, 841) cases were missing Indigenous status A total 89% (33,673) cases were treated as non-Indigenous for this analysis Results
Results * excluding two jurisdictions ^ age standardised using indirect standardisation
National data collection without a useful data dictionary Collecting national data during an emergency response with changing phases Missing data, including Indigenous status, made some analyses difficult Existing co-morbidities may be a contributing factor Discussion
Indigenous people are over represented in pH1N1 data. Interventions for co-morbidities could be considered Collection of data needs better coordination to minimise differences across jurisdictions Results assist planning for future pandemics Public Health Impact
State and territory public health units for providing the data Paul Kelly academic supervisor Martyn Kirk field supervisor Department of Health and Ageing for funding the Master of Applied Epidemiology program (Australian FTEP) Acknowledgements