Download
1 / 30
300 likes | 468 Views
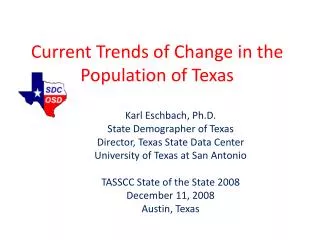
Implications for Education, the Labor Force, and Economic Development . Population Change in Texas and Houston. Steve H. Murdock, Director Hobby Center for the Study of Texas and Allyn and Gladys Cline Professor of Sociology Rice University.

E N D
Implications for Education, the Labor Force, and Economic Development Population Change in Texas and Houston Steve H. Murdock, DirectorHobby Center for the Study of Texasand Allyn and Gladys Cline Professor of SociologyRice University Hobby Center for the Study of Texas at Rice University
Total Population and Percent Population Changein Texas and the United States, 1850-2010 Hobby Center for the Study of Texas at Rice University
Population 2000 and 2010 and Population Change 2000-2010 for the Ten Most Populous Incorporated Places in the United States
Councils of Governments in Texas Ranked by Total Population in 2010: Total Population in 2000 and 2010; Numeric and Percent Change, 2000-2010; and Percent of the State Population (2010) and State Population Change
Total Population in 2000 and 2010 in Metropolitan Statistical Areas in Texas Ranked by Numerical Change Between 2000 and 2010 Source: U.S. Census Bureau *Reflects total population for Texas portion of MSA only.
Population, Population Change, and Proportion of the Total Population by Race/Ethnicity for the State of Texas, 2000 and 2010
Population, Population Change, and Proportion of the Population Age 18+ Years of Age by Race/Ethnicity for Texas, 2000 and 2010
Population, Population Change, and Proportion of the Population Less than 18 Years of Age by Race/Ethnicity for Texas, 2000 and 2010
Population, Population Change, and Proportion of the Total Population by Race/Ethnicity for the United States, 2000 and 2010 *Hispanic includes persons of all races. All other race/ethnicity categories shown here are Non-Hispanic. Non-Hispanic Other includes persons identifying themselves as Non-Hispanic American Indian or Alaska Native, Non-Hispanic Native Hawaiian or Pacific Islander, Non-Hispanic Some Other Race, or Non-Hispanic and a combination of two or more races. Source: U.S. Census 2000 & 2010, P.L. 94-171 Prepared by the Hobby Center for the Study of Texas at Rice University http://HobbyCenter.Rice.edu
Population, Population Change, and Proportion of the Population Under Age 18 by Race/Ethnicity for the United States, 2000 and 2010 *Hispanic includes persons of all races. All other race/ethnicity categories shown here are Non-Hispanic. Non-Hispanic Other includes persons identifying themselves as Non-Hispanic American Indian or Alaska Native, Non-Hispanic Native Hawaiian or Pacific Islander, Non-Hispanic Some Other Race, or Non-Hispanic and a combination of two or more races. Source: U.S. Census 2000 & 2010, P.L. 94-171 Prepared by the Hobby Center for the Study of Texas at Rice University http://HobbyCenter.Rice.edu
Population, Population Change, and Proportion of the Total Population by Race/Ethnicity for the Houston-Sugar Land-Baytown MSA, 2000 and 2010
Population, Population Change, and Proportion of the Population Less than 18 Years of Age by Race/Ethnicity for the Houston-Sugar Land-Baytown MSA, 2000 and 2010
Population, Population Change, and Proportion of the Total Population by Race/Ethnicity for the City of Houston, 2000 and 2010
Population, Population Change, and Proportion of the Population Less Than 18 Years of Age by Race/Ethnicity for the City of Houston, 2000 and 2010
POPULATION CHARACTERISTICS AND SOCIOECONOMIC CONDITIONS Hobby Center for the Study of Texas at Rice University
Total and Percent of the Texas Population in Poverty and Median Household Income by Race/Ethnicity, 1999 and 2009 *In 2009 Dollars Source: U.S. Census Bureau, Census 2000 and American Community Survey, 2009
Educational Attainment for the Texas Population Age 25 and Older by Race/Ethnicity, 2009
PROJECTIONS Hobby Center for the Study of Texas at Rice University
Population in Harris County by Race/Ethnicity in 2000 and Projectionsby Race/Ethnicity from 2010 to 2040
Percent of Population in Harris County by Race/Ethnicity in 2000and Projections of the Population in Harris County byRace/Ethnicity from 2010 to 2040
Total Public School Students by Race/Ethnicity in the 10 Largest* School Districts in Texas, 2000-2001 and 2010-2011 *Largest enrollment based on 2010-2011 school year Source: Data compiled by the Texas State Data Center from Texas Education Agency, Academic Excellence Indicator System (AEIS) District Profiles
The mark of a truly educated man is to be moved deeply by statistics. George Bernard Shaw
Steve Murdock Phone: 210-867-4385 E-mail: shm3@rice.edu Website: http://hobbycenter.rice.edu