Download
1 / 20
200 likes | 306 Views
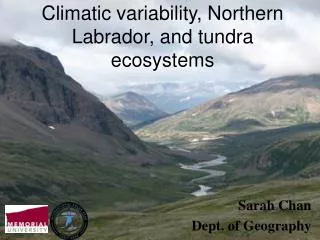
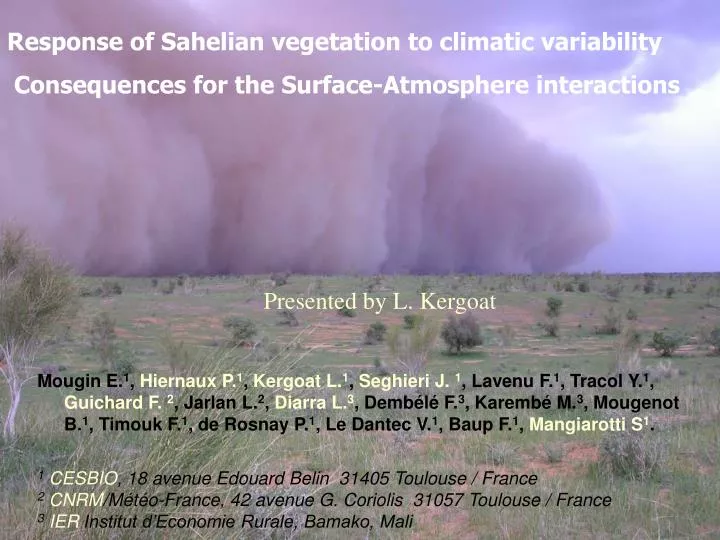
Response of Sahelian vegetation to climatic variability Consequences for the Surface-Atmosphere interactions. Presented by L. Kergoat.

E N D
Response of Sahelian vegetation to climatic variability Consequences for the Surface-Atmosphere interactions Presented by L. Kergoat Mougin E.1, Hiernaux P.1, Kergoat L.1, Seghieri J. 1, Lavenu F.1, Tracol Y.1, Guichard F. 2, Jarlan L.2, Diarra L.3, Dembélé F.3, Karembé M.3, Mougenot B.1, Timouk F.1, de Rosnay P.1, Le Dantec V.1, Baup F.1, Mangiarotti S1. 1CESBIO, 18 avenue Edouard Belin 31405 Toulouse / France 2CNRM/Météo-France, 42 avenue G. Coriolis 31057 Toulouse / France 3IER Institut d’Economie Rurale, Bamako, Mali
Eco-climatic zones of WA • Sahel usually delimited by 100 - 600 mm annual rainfall
Characteristics of the Sahelian vegetation Trees } Wood layer Shrubs Grass layer Perennial grasses Annual grasses crops (millet, sorghum)
Rainfall variability of rainfall over Sahel (10°N – 20°N) High spatial variability (courtesy Lebel et coll.) add soil type and land use, you get vegetation variability which is very high.
Long term sites network established in 1984 (extrem drought) Grass biomass tree density species % bare soil sample 1 km transect consistent with satellite Hiernaux (ILCA) and Diarra (IER), 1984, Cesbio+IER from 1996 onward
09/85 09/84 09/86 09/87 09/88 09/92 09/89 08/90 09/93 09/00 09/99
Phenology and growth of Sahelian vegetation • annuals : direct response to rainfall (temporal distribution of rainfall events) Seasonal and interannual dynamics Model STEP vs data Mougin et al Biomass variability explained by climate+vegetation model
Interannual herbaceous productivity Observation period STEP model Mougin et al Large variability + non linearity (rainfall distribution, dry spells)
AVHRR trend Anyamba and Tucker 2005 J Arid Envir. ‘greening’ of Sahel special issue
Consequences for Surface / Atmosphere Interactions 1) Characterize time/space variability of vegetation and fluxes response at site, landscape, and West African gradient scales AMMA will do it Sahel vegetation : Large temporal variability Grass and crop phenology responds quickly non linearity Sahelian ecosystems show SOME resilience properties view of Sahel drought has changed since the 70’ 80’
Rainfall Gourma mesoscale Site (~300 x 100 km²) 50 mm Bamba local Site(17.1°N, 1.3°W) 100 mm Niger River 300 mm Hombori Supersite(15.4°N, 1.6°W) 350 mm See posters Seghieri et al Le Dantec et al and TT3 Agoufou local Site(15.3°N, 1.5°W) 450 mm
Albedo of Agoufou grassland 2002 albedo dry rainfall 2003 wet 2004 dry 2005 wet Day of year Guichard et al
Surface Net Radiation for Agoufou grassland 2002 dry 2003 higher wet 2004 dry 2005 higher wet Guichard et al
IRIR SW SW Rnet (W.m-2) 500 400 300 200 2002 100 2003 0 2004 -100 2005 -200 -300 -400 -500 -600 IRIR SW SW Rnet (W.m-2) -400 +460 -250 +50 -140 20 10 2002 0 2003 2004 -10 2005 -20 -30 -40 Radiative balance, Agoufou August 2002 to 2005 Wet (2003 & 2005) = low SW down but low albedo and low IR up result : more energy for sensible and latent heat flux (and thetae) Rn - G = LE +H Guichard et al Models probably able to simulate this (ask ALMIP)
Tree leaf phenology Interannuel effects … for SOME species or SOME trees/shrubs Fluxes ? Models ? Hiernaux Seghieri
Consequences for Surface / Atmosphere Interactions 2) Sahelian paradoxes Mare dAgoufou : temporary pond before 1984 permanent pond after the 1984 drought. Less rain, more run on. Why ? (crops not responsible) Hiernaux pers obs Increasing water table (Niger) : more runoff (crops, fallows), more infiltration from ponds. Favreau et al Tiger bush shrinks, increase of runoff Valentin et al 01, Wu et al 05 Increased river runoff in the Sahelian zone, as opposed to decreased in Soudanian zone Mahé et al 05 Changes in vegetation -but different cases - and soil surface. ‘le diable est dans les détails’. What would be the typical time scale of return to pre-drought state ? Water routing versus vegetation recovery ? What about models ?
3) The Quest for Memory : time lags effects ? Sahelian droughts are better simulated when droughts impact ecosystems on time > 1 year e.g. Zeng et al 99 Lag effects are present in rainfall and/or remote sensing data e.g. Philippon et al Current year -> current growth, Rn, ETR of annual grasses OK Tree : leaf phenology depends on yr, yr-1 depending on tree species yr-1, yr-2 seed bank effect ? Wind erosion ? Litter/nutrient effect ? Species dynamic effect ?
Asymetry wet/dry hysteresis Impact on fluxes ? Similar shemes for trees, crops/fallow LSM, SVAT …. Population dynamics of grass species and links to rainfall (Gourma 84-93) Hiernaux, Diarra
SUMMARY Sahelian ecosystems : high time and space variability some resilience ? Need for long term sites, network of sites. (really) Surface / atmosphere interactions Intra-seasonal : some confidence in vegetation/SVAT models Trends : some confidence in models (rain driven) Multi year effect : tree phenology more to learn but we already know something (LE flux ?) Sahelian paradoxes : challenging ! Series of interactions vegetation/surface/runoff no idea of associated fluxes changes