Download
1 / 27
280 likes | 403 Views
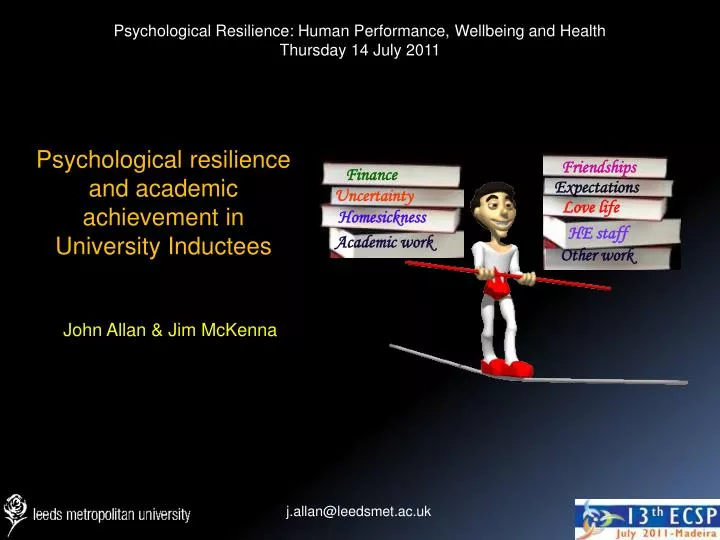
Psychological Resilience: Human Performance, Wellbeing and Health Thursday 14 July 2011 . Psychological resilience and academic achievement in University Inductees. Friendships. Finance. Expectations. Uncertainty. Love life. Homesickness. HE staff. Academic work. Other work.

E N D
Psychological Resilience: Human Performance, Wellbeing and Health Thursday 14 July 2011 Psychological resilience and academic achievement in University Inductees Friendships Finance Expectations Uncertainty Love life Homesickness HE staff Academic work Other work John Allan & Jim McKenna j.allan@leedsmet.ac.uk
Acknowledgements Projects supported by Leeds Metropolitan University research grants in Higher Education Assessment, Teaching & Learning John Allan Jim McKenna j.allan@leedsmet.ac.uk
The tightrope of Higher Education (HE) Finance Friendships Uncertainty HE staff • Resilience : Balance and shifting along a continuum • Links to competence and growth Expectations Homesickness Love life Academic work Other work Surviving Thriving • New students – gender differences and achievement
Higher Education (HE) in the UK More students accessing HE 2003 - 2008 23% 2003-2008, universities induct 23% more students into HE “Staying the Course”, House of Commons, 2008
Higher Education (HE) in the UK More students accessing HE 2003 - 2008 23% WP students unable to draw on wider social networks HE Statistics Agency, 2008
Higher Education (HE) in the UK More students achieving in HE 1996/7 - 2006/7 2:1s & Firsts 23% 7% Education Briefing Book, 2008
Higher Education (HE) in the UK Female students achieve in HE • 12% more females than males in HE • 6% more females complete • 4% more females gain “Good degrees” • (Firsts or 2:1) 23% 7% 12% Higher Education Funding Council, 2007
New HE students More mental ill-health in HE students compared with age-matched controls, related in part to HE stresses 1 in 10 don’t continue beyond first year, 2 in 10 don’t finish, despite £800 million since 2006 Feelings of isolation, staff remoteness lack of timely & meaningful feedback Royal College of Psychiatrists, 2006 Staying the Course, House of Commons, 2008 Kirk & Gleaves, 2009
Resilience Maintaining internal well-being and adapting to the external environment Personal growth Bounce-back-ability Bounce-beyond-ability Capability in Uncertainty “Knowing what to do when you don’t know what to do” Piaget, 1963 Strong links to capability and competence in sports performance Mummery et al, 2004
Resilience - in the context of Higher Education Maintaining internal well-being and adapting to the external environment Personal growth Bounce-back-ability Bounce-beyond-ability Capability in Uncertainty “Knowing what to do when you don’t know what to do” Piaget, 1963 Strong links to capability and competence in sports performance Mummery et al, 2004
Resilience as a trajectory Norris et al (2009)
New students: Gender social social New female students most anxiousCooke et al 2006 A higher variety of mental health issues Kleinfield, 2009 Characterised by mutuality and seeking help Jordan, 2006 Reluctance for counselling - characterised by gender straitjacketingPollack, 2006 Instrumental coping styles Tend - Be-friend coping styles Bravado and pseudo-resilience? Relational resilience (Hartling, 2003)
Purpose • To profile the psychological resilience of inductees (sports students) • To establish relationship of baseline resilience with academic performance • Evaluate far transfer over the academic cycle
Design – Stage 1 • Baseline of psychological resilience conducted • over 4 consecutive years of 15 sports courses
Measuring Psychological Resilience I could deal with whatever came along Not at all true True nearly all the time 0 1 2 3 4 A validated scale for young people (Connor-Davidson Scale, CD-RISC, 2003) ‘How have you felt about yourself over the PAST MONTH?’ • Provides a single score (range 0 to 100) • Baseline profiles (total score & 5 subscales) DisagreeAgree 1. When I make plans I follow through with them DisagreeAgree 1. When I make plans I follow through with them DisagreeAgree 1. When I make plans I follow through with them DisagreeAgree 1. When I make plans I follow through with them DisagreeAgree 1. When I make plans I follow through with them 1 2 3 4 5 6 7 1 2 3 4 5 6 7 1 2 3 4 5 6 7 1 2 3 4 5 6 7 1 2 3 4 5 6 7 1 2 3 4 5 6 7
Design – Stage 2 • Two step cluster analysis for meaningful groupings • rather than relationships between variables Females Males CD-RISC control, trust spirit, change competence CD-RISC control, trust spirit, change competence
Design – Stage 3 • Clusters cross-tabulated with end of year grade • classification
Results Stage 1: No mean resilience profile differences (0-32) Resilience score,0-100 (0-24) n=775 n=710 (0-20) (0-16) Mean age 18.60 SD 1.48 (0-8) CD-RISC and Subscales
ResultsStage 1: Males higher resilience 57% above mean 55% above mean
ResultsStage 2: Four clusters of resilience: Means 30.6% 454 26.5% 393 CD-RISC 84.20 (6.11) CD-RISC 85.04 (5.87) Control 10.40 Trust 22.36 Spirit 5.35 Change 17.83 Comp 29.09 Control 10.19 Trust 22.40 Spirit 4.81 Change 17.56 Comp 29.24 21.6% 321 21.3% 317 CD-RISC 62.44 (6.91) CD-RISC 62.58 (8.19) Control 7.56 Trust 16.74 Spirit 3.23 Change 12.72 Comp 22.32 Control 7.50 Trust 16.84 Spirit 2.90 Change 12.80 Comp 22.40 Clusters included all 15 sports courses, No cohort effect
Results Stage 3: Clusters and subsequent achievement % of Total Degree Classifications end of Year One
Results Stage 3: Clusters and subsequent achievement % of Total Degree Classifications end of Year One
ResultsStage 3: Intra-cluster achievement 42% 2:1 & above, 12% fail or third 75% fail, third and 2:2 categories Over 8 out of ten 2:2, 2:1 or above Over 8 out of ten fail, third or 2:2
Limitations • Self-report measure may only provide insight into a complex area – resilience single element, multiple routes to adaptability • Sophisticated profiling of inductees inc qualitative data • Time lapse of measures – longitudinal interim measurement required in the context of learning behaviours (near transfer evaluation)
Summary • Significant numbers and courses • No gender profiles of resilience based on mean scores for subscales or clusters • Need to evaluate resilience and learning behaviours in context (resilience x environment) • 10% of high resilience males gain a third or fail • Far transfer suggested for both clusters of females for university assessment • Relationship of resilience to first year achievement outcomes (resilience not universally equated to end of year profiles)
Thank you for your attention j.allan@leedsmet.ac.uk