Download
1 / 1
10 likes | 285 Views
Desalination of Brackish Water by Reverse Osmosis Jennifer Kanchukova, Natalie Tran, Jeff Kunkle Advisors: Jan Talbot, Ph.D. & Richard Herz, Ph.D. Chemical Engineering Program University of California, San Diego. Objectives S To construct a reverse osmosis setup to desalinate brackish water

E N D
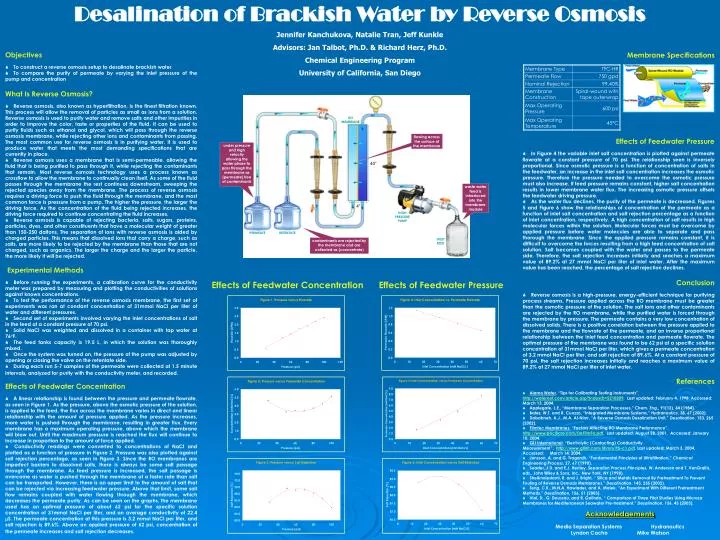
Desalination of Brackish Water by Reverse Osmosis Jennifer Kanchukova, Natalie Tran, Jeff Kunkle Advisors: Jan Talbot, Ph.D. & Richard Herz, Ph.D. Chemical Engineering Program University of California, San Diego Objectives S To construct a reverse osmosis setup to desalinate brackish water S To compare the purity of permeate by varying the inlet pressure of the pump and concentration Membrane Specifications What Is Reverse Osmosis? SReverse osmosis, also known as hyperfiltration, is the finest filtration known. This process will allow the removal of particles as small as ions from a solution. Reverse osmosis is used to purify water and remove salts and other impurities in order to improve the color, taste or properties of the fluid. It can be used to purify fluids such as ethanol and glycol, which will pass through the reverse osmosis membrane, while rejecting other ions and contaminants from passing. The most common use for reverse osmosis is in purifying water. It is used to produce water that meets the most demanding specifications that are currently in place. SReverse osmosis uses a membrane that is semi-permeable, allowing the fluid that is being purified to pass through it, while rejecting the contaminants that remain. Most reverse osmosis technology uses a process known as crossflow to allow the membrane to continually clean itself. As some of the fluid passes through the membrane the rest continues downstream, sweeping the rejected species away from the membrane. The process of reverse osmosis requires a driving force to push the fluid through the membrane, and the most common force is pressure from a pump. The higher the pressure, the larger the driving force. As the concentration of the fluid being rejected increases, the driving force required to continue concentrating the fluid increases. S Reverse osmosis is capable of rejecting bacteria, salts, sugars, proteins, particles, dyes, and other constituents that have a molecular weight of greater than 150-250 daltons. The separation of ions with reverse osmosis is aided by charged particles. This means that dissolved ions that carry a charge, such as salts, are more likely to be rejected by the membrane than those that are not charged, such as organics. The larger the charge and the larger the particle, the more likely it will be rejected. RO MEMBRANE flowing across the surface of the membrane Effects of Feedwater Pressure S In Figure 4 the variable inlet salt concentration is plotted against permeate flowrate at a constant pressure of 70 psi. The relationship seen is inversely proportional. Since osmotic pressure is a function of concentration of salts in the feedwater, an increase in the inlet salt concentration increases the osmotic pressure. Therefore the pressure needed to overcome the osmotic pressure must also increase. If feed pressure remains constant, higher salt concentration results in lower membrane water flux. The increasing osmotic pressure offsets the feedwater driving pressure. S As the water flux declines, the purity of the permeate is decreased. Figures 5 and Figure 6 show the relationships of concentration of the permeate as a function of inlet salt concentration and salt rejection percentage as a function of inlet concentration, respectively. A high concentration of salt results in high molecular forces within the solution. Molecular forces must be overcome by applied pressure before water molecules are able to separate and pass thorough the membrane. Since the applied pressure remains constant, it is difficult to overcome the forces resulting from a high feed concentration of salt solution. Salt becomes coupled with the water and passes to the permeate side. Therefore, the salt rejection increases initially and reaches a maximum value of 89.2% at 27 mmol NaCl per liter of inlet water. After the maximum value has been reached, the percentage of salt rejection declines. under pressure and high velocity allowing the water phase to pass through the membrane as (permeate) free of contaminants 40” waste water feed is introduced into the membrane module 4” HIGH PRESSURE PUMP PERMEATE RETENTATE INLET FEED contaminants are rejected by the membrane and are collected as (concentrate) Experimental Methods S Before running the experiments, a calibration curve for the conductivity meter was prepared by measuring and plotting the conductivities of solutions against known concentrations. S To test the performance of the reverse osmosis membrane, the first set of experiments was ran at constant concentration of 31mmol NaCl per liter of water and different pressures. S Second set of experiments involved varying the inlet concentrations of salt in the feed at a constant pressure of 70 psi. S Solid NaCl was weighted and dissolved in a container with tap water at 76°F. S The feed tanks capacity is 19.5 L, in which the solution was thoroughly mixed. S Once the system was turned on, the pressure of the pump was adjusted by opening or closing the valve on the retentate side. S During each run 5-7 samples of the permeate were collected at 1.5 minute intervals, analyzed for purity with the conductivity meter, and recorded. Conclusion S Reverse osmosis is a high-pressure, energy-efficient technique for purifying process streams. Pressure applied across the RO membrane must be greater than the osmotic pressure of the solution. The salt ions and other contaminants are rejected by the RO membrane, while the purified water is forced through the membrane by pressure. The permeate contains a very low concentration of dissolved solids. There is a positive correlation between the pressure applied to the membrane and the flowrate of the permeate, and an inverse proportional relationship between the inlet feed concentration and permeate flowrate. The optimal pressure of the membrane was found to be 62 psi at a specific solution concentration of 31mmol NaCl per liter, which gives a permeate concentration of 3.2 mmol NaCl per liter, and salt rejection of 89.6%. At a constant pressure of 70 psi, the salt rejection increases initially and reaches a maximum value of 89.2% at 27 mmol NaCl per liter of inlet water. Effects of Feedwater Concentration Effects of Feedwater Pressure References S Alamo Water, “Tips for Calibrating Testing Instruments”,http://waternet.com/article.asp?IndexID=5210209. Last updated: February 4, 1998. Accessed: March 13, 2004. S Applegate, L.E., “Membrane Separation Processes,” Chem. Eng., 91(12), 64 (1984). S Bates, W.T. and R. Cuozzo, “Integrated Membrane Systems,” Hydranautics, 38, 67 (2002). S Dababneh, A.J., M.A. Al-Nimr, “A Reverse Osmosis Desalination Unit,” Desalination, 153, 265 (2002). S Filmtec Membranes, “Factors Affecting RO Membrane Performance”, http://www.pacificro.com/DeFilmFa.pdf. Last updated: August 28, 2001. Accessed: January 10, 2004. S GLI International, “Electrolytic (Contacting) Conductivity Measurement”, http://www.gliint.com/library/tb-c1.pdf. Last updated: March 3, 2004. Accessed: March 14, 2004. S Jonsson, A. and G. Tragardh, “Fundamental Principles of Ultrafiltration,” Chemical Engineering Process, 27, 67 (1990). S Seader, J.D. and E.J. Henley, Separation Process Principles, W. Anderson and T. VenGraitis, eds., John Wiley & Sons, Inc., New York, NY (1998). S Sheiknoleslami, R. and J. Bright, “ Silica and Metals Removal By Pretreatment To Prevent Fouling of Reverse Osmosis Membranes,” Desalination, 143, 255 (2002). S Teng, C.K., M.N.A. Hawlader, and A. Malek, “An Experiment With Different Pretreatment Methods,” Desalination, 156, 51 (2003). S Vial, D., G. Doussau, and R. Galindo, “ Comparison of Three Pilot Studies Using Microza Membranes for Mediterranean Seawater Pre-treatment,” Desalination, 156, 43 (2003). Effects of Feedwater Concentration S A linear relationship is found between the pressure and permeate flowrate, as seen in Figure 1. As the pressure, above the osmotic pressure of the solution, is applied to the feed, the flux across the membrane varies in direct and linear relationship with the amount of pressure applied. As the pressure increases, more water is pushed through the membrane, resulting in greater flux. Every membrane has a maximum operating pressure, above which the membrane will blow out. Until the maximum pressure is reached the flux will continue to increase in proportion to the amount of force applied. S Conductivity readings were converted to concentrations of NaCl and plotted as a function of pressure in Figure 2. Pressure was also plotted against salt rejection percentage, as seen in Figure 3. Since the RO membranes are imperfect barriers to dissolved salts, there is always be some salt passage through the membrane. As feed pressure is increased, the salt passage is overcome as water is pushed through the membrane at a faster rate than salt can be transported. However, there is an upper limit to the amount of salt that can be rejected via increasing feedwater pressure. Above that limit, some salt flow remains coupled with water flowing through the membrane, which decreases the permeate purity. As can be seen on the graphs, the membrane used has an optimal pressure of about 62 psi for the specific solution concentration of 31mmol NaCl per liter, and an average conductivity of 22.4 S. The permeate concentration at this pressure is 3.2 mmol NaCl per liter, and salt rejection is 89.6%. Above an applied pressure of 62 psi, concentration of the permeate increases and salt rejection decreases. Acknowledgements Media Separation Systems Hydranautics Lyndon Cacho Mike Watson