Download
1 / 52
520 likes | 742 Views
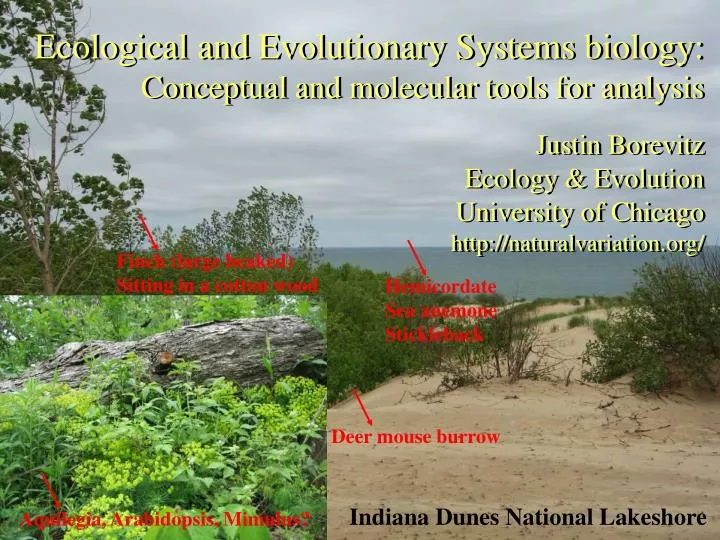
Ecological and Evolutionary Systems biology: Conceptual and molecular tools for analysis Justin Borevitz Ecology & Evolution University of Chicago http://naturalvariation.org/.

E N D
Ecological and Evolutionary Systems biology: Conceptual and molecular tools for analysisJustin BorevitzEcology & EvolutionUniversity of Chicagohttp://naturalvariation.org/ Ecological and Evolutionary Systems biology: Conceptual and molecular tools for analysisJustin BorevitzEcology & EvolutionUniversity of Chicagohttp://naturalvariation.org/ Deer mouse burrow Finch (large beaked) Sitting in a cotton wood Hemicordate Sea anemone Stickleback Aquilegia, Arabidopsis, Mimulus? Indiana Dunes National Lakeshore
Developing Model Organisms - Community • Critical mass of labs, hands/eyes/minds • Coordinated collaboration • webinar lab meetings • Open chat/ focus problems/ big picture meetings • United by questions • Development: novelty/plasticity • Adaptation: abiotic/biotic • United by organism • Shared tools: genomic/ genetic/ methods • United by ecoregion – field study site • Soil/ water testing, weather monitoring, development/behavioral real time recording
Developing Model Organisms - Tools • High throughput Phenotyping • Physiological dissection of 1000s correlated traits • Biological Variation • Multi species ecological interactions • “extended phenotype” • Environmental Interaction (GxE) • Local adaptation • Epistasis (GxG) • Magnify minor QTL in local backgrounds • Multiple genes under major QTL • High Density markers • Linkage Drag • Functional Genomics • Microarrays • SNPs • Induced deletions
Talk Outline Talk Outline • Genetic Diversity • Population structure, Haplotype Mapping set • Phenotyping in multiple environments • Seasonal Variation in the Lab • SNP/Tiling microarrays • Splicing • Methylation • Very High Density Markers SFPs • Bulk Mapping • Deletions • Genetic Diversity • Population structure, Haplotype Mapping set • Phenotyping in multiple environments • Seasonal Variation in the Lab • SNP/Tiling microarrays • Splicing • Methylation • Very High Density Markers SFPs • Bulk Mapping • Deletions
Global and Local Population Structure Olivier Loudet
Seasonal Variation Matt Horton Megan Dunning
Local Population Structure common haplotypes 144 Non singleton SNPs >2000 accessions Global, Midwest, and UK Megan Dunning, Yan Li
Diversity within and between populations 80 Major Haplotypes
Diversity within and between populations 17 Major Haplotypes 80 Major Haplotypes
Variation within a field http://naturalvariation.org/hapmap Variation within a field http://naturalvariation.org/hapmap
Begin with regions spanning the Native Geographic range Lund Sweden Nordborg et al PLoS Biology 2005 Li et al PLoS ONE 2007 Tossa Del Mar Spain
Seasons in the Growth Chamber Seasons in the Growth Chamber Sweden Spain • Changing Day length • Cycle Light Intensity • Cycle Light Colors • Cycle Temperature • Changing Day length • Cycle Light Intensity • Cycle Light Colors • Cycle Temperature Geneva Scientific/ Percival
Solar Calc II • Kurt Spokas • Version 2.0a June 2006 • USDA-ARS Website Midwest Area (Morris,MN) • http://www.ars.usda.gov/mwa/ncscrl
Flowering time QTL, Kas/Col RILs Flowering time QTL, Kas/Col RILs
Genomic Breeding Path Experimental Design Mapping population Marker Identification Genotyping Phenotyping QTL Analysis Fine Mapping Candidate gene Polymorphisms gene expression loss of function QTL gene Confirmation QTL gene Confirmation Phenotyping QTL Analysis Fine Mapping Genomics path Experimental Design Mapping population Borevitz and Chory, COPB 2003
Which arrays should be used? BAC array cDNA array Long oligo array
Which arrays should be used? Gene array Exon array Tiling array 35bp tile, 25mers 10bp gaps
Which arrays should be used? SNP array How about multiple species? Microbial communities? Pst,Psm,Psy,Psx, Agro, Xanthomonas, H parasitica, 15 virus, Ressequencing array Tiling/SNP array 2007 250k SNPs, 1.6M tiling probes
Improved Genome Annotation ORFa Transcriptome Atlas ORFb start AAAAA deletion M M M M M M M M M M M M SFP SNP SNP SFP SFP conservation Chromosome (bp)
Universal Whole Genome Array DNA RNA Gene/Exon Discovery Gene model correction Non-coding/ micro-RNA Chromatin Immunoprecipitation ChIP chip Alternative Splicing Methylation Antisense transcription Polymorphism SFPs Discovery/Genotyping Transcriptome Atlas Expression levels Tissues specificity Comparative Genome Hybridization (CGH) Insertion/Deletions Copy Number Polymorphisms RNA Immunoprecipitation RIP chip Allele Specific Expression Control for hybridization/genetic polymorphisms to understand TRUE expression variation
Col Van Alternative spliced exons - verification v v v c c c v c RT-PCR gDNA PCR
Global Allele Specific Expression 65,000 SNPs Transcribed Accession Pairs 12,000 genes >= 1 SNP 6,000 >= 2 SNPs Zhang, X., Richards, E., Borevitz, J. Current Opinion in Plant Biology (2007)
SFP mSFP Van Van Col Van Col Van Hpa msp Hpa msp Hpa msp SFPs and CC*GG Methylome * * * * A) HpaII digestion Extract genomic 100ng DNA (single leaf) Digest with either msp1 or hpa2 CC*GG Label with biotin Random primers Hybridize to array * * * Random labeling * B) * * * MspI digestion Random labeling Intensity Col Col Hpa msp
SFP detection on tiling arrays Delta p0 FALSE Called FDR 1.00 0.95 18865 160145 11.2% 1.25 0.95 10477 132390 7.5% 1.50 0.95 6545 115042 5.4% 1.75 0.95 4484 102385 4.2% 2.00 0.95 3298 92027 3.4%
Chip genotyping of a Recombinant Inbred Line 29kb interval
100 bibb mutant plants Map bibb 100 wt mutant plants
bibb mapping Bulk segregant Mapping using Chip hybridization bibb maps to Chromosome2 near ASYMETRIC LEAVES1 AS1 ChipMap
BIBB = ASYMETRIC LEAVES1 AS1 (ASYMMETRIC LEAVES1) = MYB closely related to PHANTASTICA located at 64cM as1 bibb Sequenced AS1 coding region from bib-1 …found g -> a change that would introduce a stop codon in the MYB domain bib-1 W49* as-101 Q107* bibb as1-101 MYB
Array Mapping chr1 chr2 chr3 chr4 chr5 Hazen et al Plant Physiology (2005)
eXtreme Array Mapping 15 tallest RILs pooled vs 15 shortest RILs pooled
Chromosome 2 16 12 RED2 QTL LOD 8 4 0 0 20 40 60 80 100 cM RED2 QTL 12cM Composite Interval Mapping eXtreme Array Mapping LOD Allele frequencies determined by SFP genotyping. Thresholds set by simulations Red light QTL RED2 from 100 Kas/ Col RILs (Wolyn et al Genetics 2004)
QTLLz x Ler F2 XAMLz x Col F2 (Werner et al Genetics 2006)
eXtreme Array Fine Mapping ~2Mb ~8cM Col Low RED2 QTL >400 SFPs High Kas X mark2 mark1 ~2 ~268 ~43 Kas Col Col Col het Col ~43 ~43 ~539 ~539 Kas het Col het het het het het ~268 ~2 ~43 Kas Kas Kas Kas Col het Select recombinants by PCR >200 from >1250 plants
Potential Deletions >500 potential deletions 45 confirmed by Ler sequence 23 (of 114) transposons Disease Resistance (R) gene clusters Single R gene deletions Genes involved in Secondary metabolism Unknown genes
FLM natural deletion Potential Deletions Suggest Candidate Genes FLOWERING1 QTL Chr1 (bp) MAF1 Flowering Time QTL caused by a natural deletion in FLM (Werner et al PNAS 2005)
Het Fast Neutron deletions FKF1 80kb deletion CHR1 cry2 10kb deletion CHR1
Natural Copy Variation on Tiling Arrays Segregating self seed from wild ME isolate (Early – Late)
Unite Genetic and Physical Map • Shotgun genomic or 454 reads • ESTs/ cDNAs/ BAC ends • 1000s of contigs • Genotype mapping population on arrays • Create very high density genetic map • Known position of genes/contigs allow QTL candidatet gene identification • Control hybridization variation for gene expression
Aquilegia (Columbines) Recent adaptive radiation, 350Mb genome
Aquilegia (Columbine) NSF Genome Complexity • Microarray floral development • QTL candidates • Physical Map (BAC tiling path) • Physical assignment of ESTs • QTL for pollinator preference • ~400 RILs, map abiotic stress • QTL fine mapping/ LD mapping • Develop transformation techniques • VIGS • Whole Genome Sequencing (JGI 2007) Scott Hodges (UCSB) Elena Kramer (Harvard) Magnus Nordborg (USC) Justin Borevitz (U Chicago) Jeff Tompkins (Clemson)