Download
1 / 1
10 likes | 115 Views
Additional File 2. A. B. ***. INPP4B/18s. COX-2/18s. *. C. Neg. #14. Dox - + - +. FLAG. Fold Change. COX-2. Tubulin. D. C INPP-1 INPP-2. INPP4B. Fold Change. COX-2. Tubulin. Additional Figure 4 . INPP4B expression inhibits expression of COX-2.

E N D
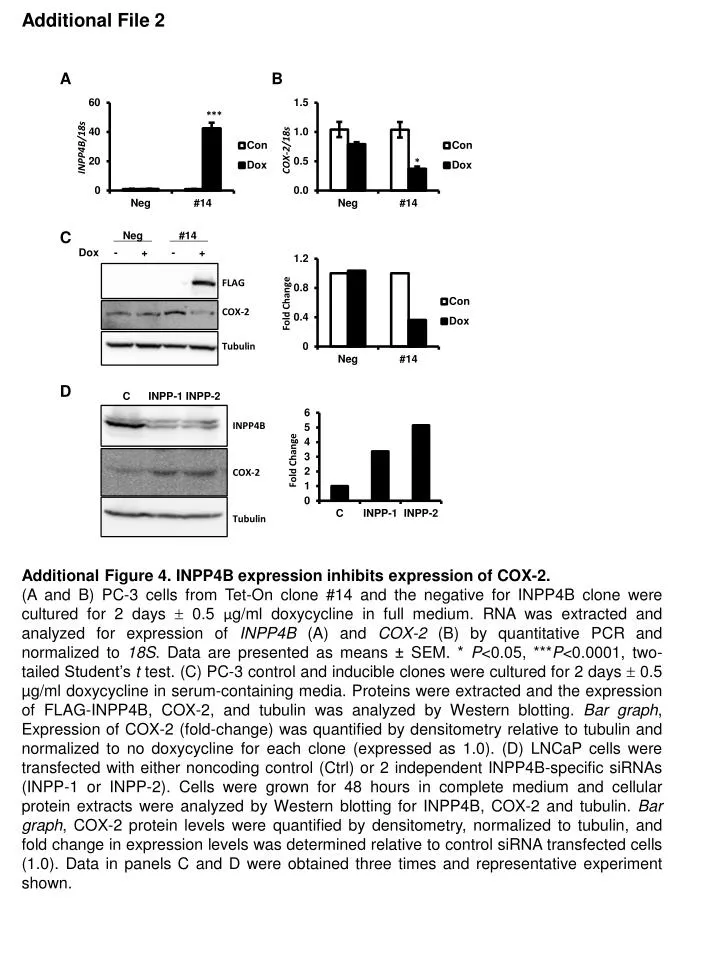
Additional File 2 A B *** INPP4B/18s COX-2/18s * C Neg #14 Dox - + - + FLAG Fold Change COX-2 Tubulin D C INPP-1 INPP-2 INPP4B Fold Change COX-2 Tubulin Additional Figure 4. INPP4B expression inhibits expression of COX-2. (A and B) PC-3 cells from Tet-On clone #14 and the negative for INPP4B clone were cultured for 2 days 0.5 μg/ml doxycycline in full medium. RNA was extracted and analyzed for expression of INPP4B (A) and COX-2 (B) by quantitative PCR and normalized to 18S. Data are presented as means ± SEM. * P<0.05, ***P<0.0001, two-tailed Student’s t test. (C) PC-3 control and inducible clones were cultured for 2 days 0.5 µg/ml doxycycline in serum-containing media. Proteins were extracted and the expression of FLAG-INPP4B, COX-2, and tubulin was analyzed by Western blotting. Bar graph, Expression of COX-2 (fold-change) was quantified by densitometry relative to tubulin and normalized to no doxycycline for each clone (expressed as 1.0). (D) LNCaP cells were transfected with either noncoding control (Ctrl) or 2 independent INPP4B-specific siRNAs (INPP-1 or INPP-2). Cells were grown for 48 hours in complete medium and cellular protein extracts were analyzed by Western blotting for INPP4B, COX-2 and tubulin. Bar graph, COX-2 protein levels were quantified by densitometry, normalized to tubulin, and fold change in expression levels was determined relative to control siRNA transfected cells (1.0). Data in panels C and D were obtained three times and representative experiment shown.