Download
1 / 34
340 likes | 468 Views
Statistical Text Categorization. By Carl Sable. Text Classification Tasks. Text Categorization (TC) - Assign text documents to pre-existing, well-defined categories. Clustering - Group text documents into clusters of similar documents.

E N D
Statistical Text Categorization By Carl Sable
Text Classification Tasks • Text Categorization (TC) - Assign text documents to pre-existing, well-defined categories. • Clustering - Group text documents into clusters of similar documents. • Information Retrieval (IR) - Retrieve text documents which match user query. • Text Filtering - Retrieve documents which match a user profile.
Text Categorization • Classify each test document by assigning pre-defined category labels. • M-ary categorization assumes M labels per document. • Binary categorization requires yes/no decision for every document/category pair. • Most techniques require training.
Early Work • The Federalist papers. • Published anonymously between 1787-1788. • Authorship of 12 papers in dispute (either Hamilton or Madison). • Mostellar and Wallace, 1963. • Compared rate per thousand words of high frequency words. • Collected very strong evidence in favor of Madison.
Rocchio • Create TF*IDF word vector for every document and category. • For each test document, compare its word vector with those of all categories. • Choose category with highest similarity score. • Many possible options!
K-Nearest Neighbors (KNN) • Create word vector for every document. • For each test document, compare its word vector with those of training documents. • Select the most similar training documents. • Use their categories (weighted) to predict category or categories of test document.
Naïve Bayes (NB) • Compute probabilities of seeing each word in each category (based on training data). • For each test document, loop through words, combining probabilities. • Can incorporate a-priori category probabilities. • Choose category that gives document highest probability. • “Naïve” because assumes word independence!
Many Other Methods • Support Vector Machines (SVMs). • Neural Nets (NNets). • Linear Least Squares Fit (LLSF). • Decision Trees. • Maximum Entropy. • Boosting.
Reuters Corpus • Common corpus for comparing methods. • Over 10,000 articles, 90 topic categories. • Binary categorization. 5 grain, wheat, corn, barley, oat, sorghum 9 earn 448 gold, acq, platinum http://www.research.att.com/~lewis/reuters21578.html
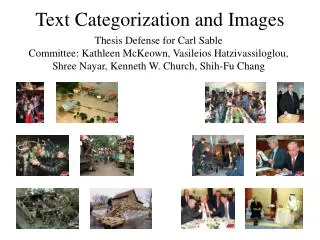
Our Corpus • Raw data was tens of thousands of postings from Clarinet newsgroups. • About 2000 articles had one or two associated images with captions. • Volunteers manually labeled images or full documents based on our instructions.
Sample Image and Caption A home along the eastern edge of Grand Forks, North Dakota lies almost completely submerged under the waters of the Red River of the North April 25. The waters of the river are beginning to recede substantially, however those homes on the eastern edge of the town faired the worst in the record flooding.
Indoor vs. Outdoor Denver Summit of Eight leaders begin their first official meeting in the Denver Public Library, June 21. They are clockwise from the top: Russian President Boris Yeltsin, U.S. President Bill Clinton, French President Jacques Chirac, Canadian Prime Minister Jean Chretien, Italian Prime Minister Romano Prodi, EU President Willem Kok, EC President Jacques Santer, British Prime Minister Tony Blair, Japanese Prime Minister Ryutaro Hashimoto and German Chancellor Helmut Kohl. Villagers look at the broken tail-end of the Fokker 28 Biman Bangladesh Airlines jet December 23, a day after it crash-landed near the town of Sylhet, in northeastern Bangladesh. All 89 passengers and crew survived the accident, mostly with minor injuries. Most of the passengers were expatriate Bangladeshis returning home from London.
Event Categories Politics Struggle Disaster Crime Other
Our Columbia System • First use Rocchio method with advanced features. • Next apply Density Estimation. • Often improves performance. • Results offer confidence measure in terms of probability.
Advanced Features • Which words to use: • Examine various text spans (captions, first sentences of captions, articles, etc.). • Restrict to specific grammatical categories (all words, open class words, etc.). • Options for disambiguating words: • Using POS tags. • Case sensitivity. • Normalization.
Density Estimation • For each test document, first use Rocchio to compute similarity to every category. • Next find all documents from training set with similar category similarities. • Use categories of these training documents to predict categories (with probabilities) of test document.
Cross Validation • Divide training set into multiple partitions of equal size (e.g. 3). • Three-fold cross validation for all possible combinations of parameters. • Compare relative performance of various settings for parameters. • Only best setting is applied to test set.
AT&T System • Group words with similar “features” together into a common “bin”. • Based on training data, empirically estimate a term weight for words in each bin. • Smoothing, works well even if there is not enough data for individual words. • Doesn’t assume simple relationships between features.
Sample Words Indoor Indicators “conference” “bed” Outdoor Indicators “airplane” “earthquake” Ambiguous “Gore” “ceremony”
Determine Bins for “airplane” • Per category bins based on IDF and category counts. • IDF(“airplane”) = 5.4. • Examine first half of training data: • Appears in 0 indoor documents. • Appears in 2 outdoor documents.
Lambdas for “airplane” • Determined at the bin level. • Examine second half of training data:
Sample Words With Scores • Indoor Indicators • “conference” • +5.91 • “bed” • +4.58 • Outdoor Indicators • “airplane” • -3.78 • “earthquake” • -4.86 • Ambiguous • “Gore” • +0.74 • “ceremony” • -0.32
Reuters Bins and Term Weights • Did not use per-category bins. • Lambdas based on log-likelihood estimates of two documents sharing same categories: • 10 closest neighbors are used to predict labels for each test document.
Per Category Measures: simple accuracy or error measures are misleading for binary categorization. Precision and recall. F-measure, average precision, and break-even point (BEP) combine precision and recall. Macro-averaging vs. Micro-averaging. Macro treats all categories equal, micro treats all documents equal. Macro usually lower since small categories are hard. Standard Evaluation Metrics (1) contingency table: p = a / (a + b) r = a / (a + c)
Standard Evaluation Metrics (2) • Mutually exclusive categories: • Each test document has only one correct label. • Each test document assigned only one label. • Performance measured by overall accuracy:
Results for Indoor vs. Outdoor • Columbia system using density estimation shows best performance. • Even beats SVMs. • System using bins very respectable.
Results for Event Categories • System using bins shows best performance. • Columbia system respectable.
Clustering • Group documents into classes: • Documents within a single class are “similar” to each other. • Documents in different classes are not. • No pre-defined categories. • Hierarchical or non-hierarchical. • Concept of a “centroid”.
Non-hierarchical Clustering • Methods are heuristic in nature. • Certain decisions, e.g. similarity threshold, made in advance. • If encounter document not similar to existing clusters, start new cluster. • Sometimes number of clusters chosen in advance.
Hierarchical Clustering • Start off with each document as own cluster. • Continuously join two “closest” clusters. • Various methods use different notions of distance between clusters. • Method determines outcome, algorithm determines efficiency. • Stop one only one cluster remains.
More on Clustering • Often used to aid information retrieval. • For dynamic environments, mechanism for updates is necessary. • Evaluation is a major problem! Human judgments often necessary.